|
|
Journal of Advanced Veterinary Research Volume 9, Issue 2, 2019, Pages: 49-55 |
|

|
Fetlock Parameters Development on Dorsopalmar Radiographs in the Equine Forelimb |
|||||||||||||||||||||||||||||||||||||||||||||||||||||||||||||||||||||||||||||||||||||||||||||||||||||||||||||||||||||||||||||||||||||||||||||||||||||||||||
|
|
|||||||||||||||||||||||||||||||||||||||||||||||||||||||||||||||||||||||||||||||||||||||||||||||||||||||||||||||||||||||||||||||||||||||||||||||||||||||||||
|
Abdulrhman M. Alrtib¹*, Aiman H. Oheida¹, Mohamed H. Abushhiwa¹, Helen M.S. Davies² |
|||||||||||||||||||||||||||||||||||||||||||||||||||||||||||||||||||||||||||||||||||||||||||||||||||||||||||||||||||||||||||||||||||||||||||||||||||||||||||
|
|
|||||||||||||||||||||||||||||||||||||||||||||||||||||||||||||||||||||||||||||||||||||||||||||||||||||||||||||||||||||||||||||||||||||||||||||||||||||||||||
|
¹Faculty of Veterinary Medicine, University of Tripoli, Tripoli 13662, Libya. ²Faculty of Veterinary and Agricultural Sciences, The University of Melbourne, Parkville 3010, Australia. |
|||||||||||||||||||||||||||||||||||||||||||||||||||||||||||||||||||||||||||||||||||||||||||||||||||||||||||||||||||||||||||||||||||||||||||||||||||||||||||
|
|
|||||||||||||||||||||||||||||||||||||||||||||||||||||||||||||||||||||||||||||||||||||||||||||||||||||||||||||||||||||||||||||||||||||||||||||||||||||||||||
|
Received: 31 January 2019, Accepted: 25 March 2019 |
|||||||||||||||||||||||||||||||||||||||||||||||||||||||||||||||||||||||||||||||||||||||||||||||||||||||||||||||||||||||||||||||||||||||||||||||||||||||||||
|
*: Corresponding author: A.Alrtib@uot.edu.ly |
|||||||||||||||||||||||||||||||||||||||||||||||||||||||||||||||||||||||||||||||||||||||||||||||||||||||||||||||||||||||||||||||||||||||||||||||||||||||||||
|
|
|||||||||||||||||||||||||||||||||||||||||||||||||||||||||||||||||||||||||||||||||||||||||||||||||||||||||||||||||||||||||||||||||||||||||||||||||||||||||||
|
Abstract |
|||||||||||||||||||||||||||||||||||||||||||||||||||||||||||||||||||||||||||||||||||||||||||||||||||||||||||||||||||||||||||||||||||||||||||||||||||||||||||
|
|
|||||||||||||||||||||||||||||||||||||||||||||||||||||||||||||||||||||||||||||||||||||||||||||||||||||||||||||||||||||||||||||||||||||||||||||||||||||||||||
|
Several reports have discussed possible bony morphological causes of fetlock pathology but without relating them to its morphometry. Radiographic measurement is widely used in constructing numerical databases of bone morphometry. Such measurements would not be reliable unless all factors affecting the radiographs were considered. Therefore, this study aimed to establish a specific dorsopalmar view (DP) for fetlock radiographic measurements, and then to develop reliable and repeatable fetlock parameters that represent fetlock conformation on those DP radiographs. Ten cadaveric forelimbs from ten adult horses were cut at the distal third of the radius and mounted in a normal posture for DP radiography. Specific features on fetlock bones were used as landmarks to identify the DP at zero degrees. Other bony features were selected as landmarks for developing fetlock parameters on these radiographs. Twenty-seven parameters were designed in the form of angles (12) and ratios (15). The repeatability and consistency of each parameter was tested. A specific fetlock DP view was determined at zero degrees based on certain landmarks. All angular and ratio parameters showed high reliability and consistency in their measurements. The established parameters provide an opportunity to test the relationship between fetlock morphometrics and performance, or the likelihood of certain pathologies. |
|||||||||||||||||||||||||||||||||||||||||||||||||||||||||||||||||||||||||||||||||||||||||||||||||||||||||||||||||||||||||||||||||||||||||||||||||||||||||||
|
Keywords: Equine, Fetlock, Morphology, Radiology |
|||||||||||||||||||||||||||||||||||||||||||||||||||||||||||||||||||||||||||||||||||||||||||||||||||||||||||||||||||||||||||||||||||||||||||||||||||||||||||
|
|
|||||||||||||||||||||||||||||||||||||||||||||||||||||||||||||||||||||||||||||||||||||||||||||||||||||||||||||||||||||||||||||||||||||||||||||||||||||||||||
|
Introduction |
|||||||||||||||||||||||||||||||||||||||||||||||||||||||||||||||||||||||||||||||||||||||||||||||||||||||||||||||||||||||||||||||||||||||||||||||||||||||||||
|
|
|||||||||||||||||||||||||||||||||||||||||||||||||||||||||||||||||||||||||||||||||||||||||||||||||||||||||||||||||||||||||||||||||||||||||||||||||||||||||||
|
Undoubtedly, wastage in the horse industry results from musculoskeletal injuries particularly in the distal forelimbs. These injuries may be related to differences in the loading (Nunamaker et al., 1991; Santschi et al., 2006; Easton and Kawcak, 2007) and conformation (Leibsle et al., 2005; Santschi et al., 2006). A number of undesirable fetlock conformations have been identified in the equine. According to Weller et al. (2006), valgus conformation in fetlock joint (metacarpophalangeal joint) was considered to be detrimental especially for jumping horses because it moved the ground reaction force away from the long axis of the limb at the level of fetlock. These authors also found that the less acute fetlock angle was related to an increased risk of tendonitis in the superficial digital flexor tendon. In respect to the right and left sides, asymmetry between the right and left fetlock joint bones was suggested to affect the coordination and balance of horses and lead to an increase in the susceptibility to injury of particular sites and bones (Watson et al., 2003; Davies and Watson, 2005; Alrtib et al., 2012). Morphometric studies on the bony elements of the equine fetlock have received a lot of attention by scientists and archaeologists. Alrtib et al. (2012), for instance, measured several geometrical parameters directly on bones of the front equine fetlock joint. That study found some significant geometrical variations not only between right and left third metacarpal bones (Mc3), proximal phalanges (P1) and proximal sesamoid bones (PSBs) but also between lateral and medial sides of the individual bones. Prado and Alberdi (1994) also recorded many dimensional measurements on bones from ancient horses including Mc3 and P1 and used the measurements to compare between some ancient horse breeds. Although these gross studies on isolated individual bones offered important morphological details about the bones, their techniques cannot be used in living horses to compare between desirable morphology and those that show pathology. Early diagnosis and treatment of conformation defects were considered to be essential to avoid the increased risk of damaging foals and horses that are conformationally unsuitable for racing (Witte and Hunt, 2009). Radiology is an easy and minimally invasive diagnostic tool to investigate bone abnormalities. It was considered to be one of the best available imaging techniques for diagnosis of bone and mineralized lesions in horses (Desmaizieres and Cauvin, 2005). In the radiographic morphometry of the equine fetlock joint however, only a few researchers have assessed fetlock bony conformation. Anthenill et al. (2006), for example, reported significant differences in dimensions between the right and left PSBs and between the medial and lateral PSBs within individual limbs of racing Thoroughbreds. Watson et al. (2003) and Davies and Watson (2005) measured the length of the right and left metacarpal bones of 46 and 40 Thoroughbred racehorses respectively from radiographs, and they found that the right metacarpal bone was significantly longer than the left metacarpal bone. However, although some radiographic morphological data on bones involved in the fetlock are available, numerous morphological features in each of those bones have not been investigated in the available literature. In equine fetlock radiology, the dorsopalmar view (DP) was described as offering a good evaluation of the morphometry of the distal third of Mc3, proximal P1 and both medial and lateral PSBs (Farrow, 2005). Technical methods for taking the standard fetlock DP view have been described in detail by a number of authors (Carlson and Gillette, 1977; Morgan, 1993; Booth and Weaver, 2005; Lavin, 2007; Weaver and Barakzai, 2010). In clinic archives however, DP views showed a wide range of differences in morphometrical details of the fetlock joints. Such variations raise the question as to whether these variations represented real anatomical differences between horses or were a result of misalignments between the radiography machine, radiography plate and the limb during radiography. Hence, establishing morphological features of a standard DP view which identified the optimal radiographic alignment was necessary for the assessment of fetlock conformation. It is clear from the literature that there is scant information about equine fetlock morphometry. Developing measurable fetlock parameters might provide an opportunity to predict the likelihood of certain pathologies and assist in selecting good performance horses. Therefore, this study was designed to identify specific features as landmarks for defining a standard DP view at zero degrees (ZDP), and secondly, to develop reliable and repeatable fetlock parameters on those ZDP radiographs. The current study hypothesized that reliable and repeatable fetlock parameters can be developed on radiographs as long as the radiograph was taken in a consistent way. |
|||||||||||||||||||||||||||||||||||||||||||||||||||||||||||||||||||||||||||||||||||||||||||||||||||||||||||||||||||||||||||||||||||||||||||||||||||||||||||
|
|
|||||||||||||||||||||||||||||||||||||||||||||||||||||||||||||||||||||||||||||||||||||||||||||||||||||||||||||||||||||||||||||||||||||||||||||||||||||||||||
|
Materials and methods |
|||||||||||||||||||||||||||||||||||||||||||||||||||||||||||||||||||||||||||||||||||||||||||||||||||||||||||||||||||||||||||||||||||||||||||||||||||||||||||
|
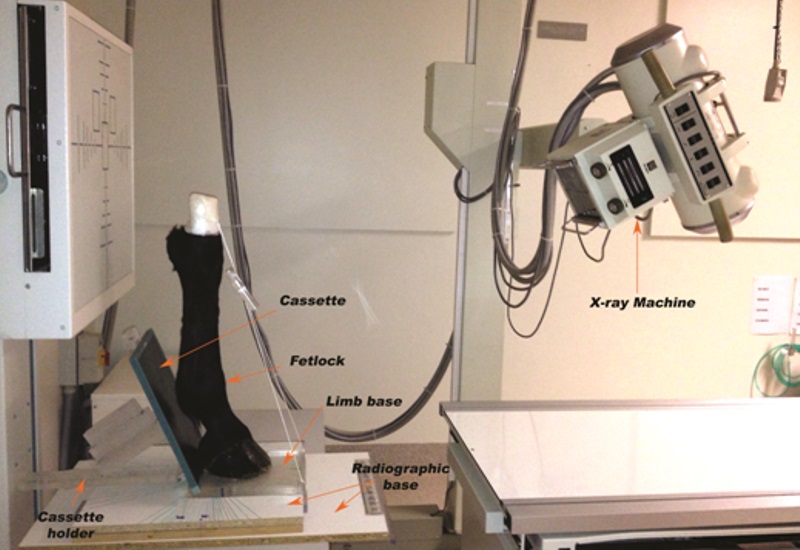
The study was designed to establish reliable and repeatable fetlock parameters through, firstly, identifying measurable parameters on a specific dorsopalmar view. Secondly, evaluating the repeatability of the identifying parameters. Then, assessing the consistency of the parameters in pre and post mortem specimens. Fetlock parameters on a specific dorsopalmar view Dorsopalmar View at Zero Angle (ZDP) In this study, a particular DP view was determined and considered as a zero DP. Since the sagittal rotation of the object would not affect the radiographic measurements of dorsopalmar radiographs (Yoon et al., 2001), determining the zero view was dependent on the rotation around the vertical and horizontal axes of the fetlock joint. Animals Ten (cadavers) forelimbs (5 right and 5 left) from ten adult horses were used. All the forelimbs were collected from the Pathology department of The University of Melbourne, Veterinary Science. The horses were euthanised or died for reasons that were not associated with the locomotor apparatus or this study. The forelimbs were cut at the distal third of the radius. Equipment The following equipment was used as reported by Oheida et al. (2016) in radiographing the distal limbs ex-vivo. It included a limb base, radiographic base, positioning step-wedge block, fixed radiography machine (Toshiba Rotanode™, Toshiba-Japan), digital cassettes (Fujifilm, Fuji IP Cassette Type CC), radiographic processor (Fujifilm FCR Capsula XL, CR-IR 356, Fuji Photo Film CO.LTD, Japan) and synapse program (Synapse Intelligent Connectivity, Version 3.1.1, Fujifilm Medical System, U.S.A. Inc. 419 West Avenue Stamford, CT 06902). A cassette holder was designed and constructed by the author. It was comprised of two long pieces of thick Perspex (35.5 mm long, 5.5 mm width and 2 mm thick) joined together at their ends. Positioning the limbs The hoof solar surface of the cut limb was screwed onto the limb base with the dorsal surface of the limb facing towards the front of the limb base. The limb was held in an extended position by tightening a thread tied through the holes of the limb base and passed around the radius. By using the thread, the limb was also manipulated lateromedially and dorsopalmarly to approximate a normal posture. Radiographing the limbs The radiographic base was fixed on a table using clamps, and the limb base with the prepared limb was placed on the marked base of the radiographic base. An imaginary line was drawn between the medial and lateral epicondyles of the distal Mc3 (Morgan, 1993). The line was then oriented to be perpendicular to the x-ray beam. Thus the dorsal aspect of the fetlock was facing the radiography machine. The radiography machine was placed at a distance of one metre from the fetlock (Walter and Davies, 2001). The head of the radiography machine was angled to be parallel to the imaginary line and the long axis of P1 (Figure 1).
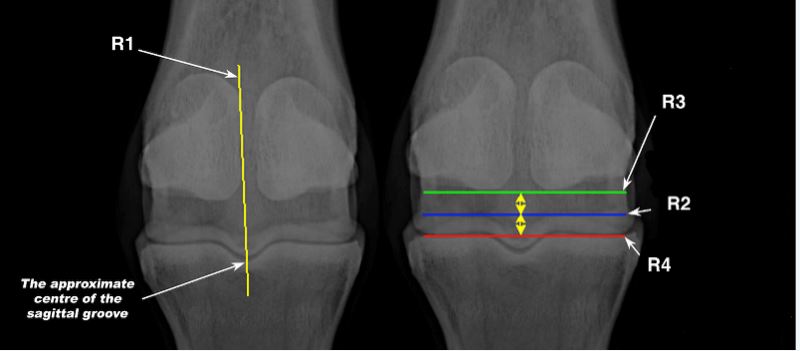
Figure 1. Radiographing a left fetlock of a Thoroughbred. The forelimb was fixed onto the limb base which was on the radiographic base. The central x-ray beam was directed perpendicular to the centre of the fetlock joint and the cassette. The cassette holder was placed behind the joint in such a way that the surface which faced the radiography machine, was perpendicular to the x-ray beam and parallel to the long axis of P1. The digital cassette was placed on the cassette holder to face the palmar aspect of the fetlock joint and lie parallel to the long axis of P1 (Figure1). The centre of the x-ray beam was pointed at the centre of the joint and a radiograph was taken. The amount of radiation varied according to the dorso-palmar thickness of the fetlock joint (Thrall, 2013). All radiographs were sent to the synapse program to be collected later on. Identifying vertical and horizontal fetlock landmarks at ZDP The vertical landmark was detected via an imaginary line which was drawn to be best fit on the axial border of the lateral sesamoid bones. The line was passed approximately through the centre of the sagittal groove of the proximal extremity of P1 (Figure 2). The horizontal landmark was identified when the line which passed through the highest points of the dorsal edges of the proximal extremity of P1 was approximately at the mid-distance between two transverse lines. The first transverse line was drawn between two points placed at the most distal extent of the visible edge of the medial and lateral joint surface of the proximal extremity of P1. The second transverse line was between the lowest points of the bases of the PSBs (Figure 2).
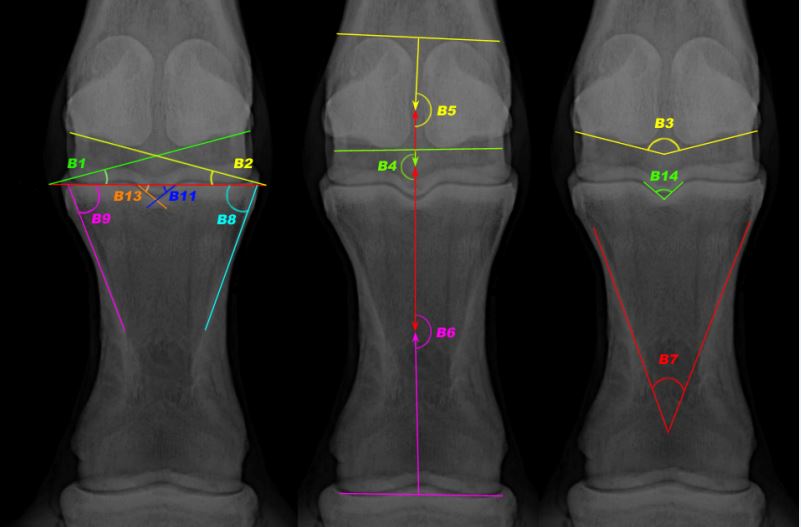
Figure 2. Dorsopalmar radiographs of a right fetlock showing the position of vertical and horizontal landmarks at ZDP. R1: line drawn to be best fit on the most axial border of the lateral sesamoid bone; R2: the line which passed through the highest points of the dorsal edges of the proximal extremity of P1; R3: line drawn between the lowest points of the sesamoid bone bases; R4: line drawn between two points placed at the most distal extent of the visible edge of the medial and lateral joint surface of the proximal extremity of P1. Fetlock measurable parameters Measurable fetlock parameters were optimized based on the possibility and accuracy of detecting their landmarks on radiographs. All parameters were designed in the form of angles and ratios to avoid effects of variation in the size of horses and magnification effects on DP radiographs. 27 parameters were selected to be analysed in this study, 12 angles (figure 3) and 15 ratios (figure 4).
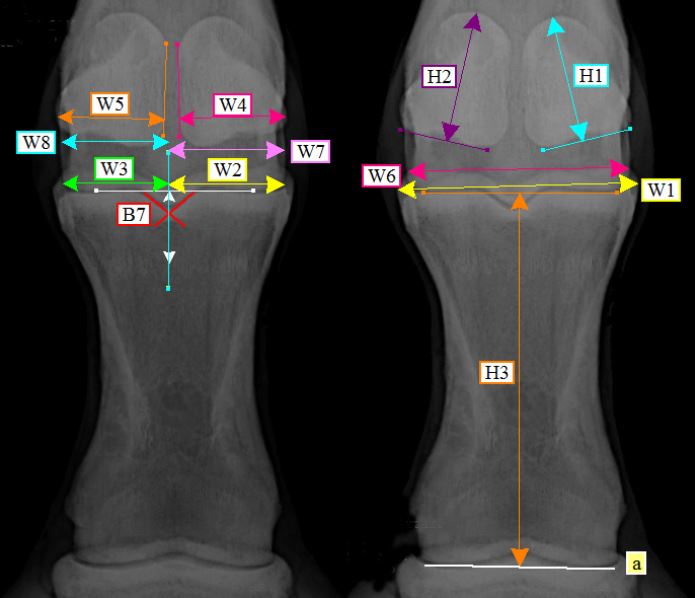
Figure 3. ZDP radiographs of a right fetlock of a TB showing all the angular parameters. Angular parameters Base medial PSB-Proximal P1 angle (B1): The angle formed between a line drawn to best fit the most distal edge of the articular surface of the medial PSB and a line extended along the proximal articular surface of P1. Base lateral PSB-Proximal P1 angle (B2): The angle formed between a line drawn to best fit the most distal edge of the articular surface of the lateral PSB and a line extended along the proximal articular surface of P1. Base PSBs angle (B3): It is the angle between two lines extended along the bases of the medial and lateral PSBs. Lowest PSBs-Proximal P1 angle (B4): The angle formed between two perpendicular lines extended from the lowest points of PSBs and from the proximal articular surface of P1. Highest PSBs-Proximal P1 angle (B5): The angle formed between a line perpendicular to the highest points of PSBs and a line perpendicular to the proximal articular surface of P1. P1 angle (B6): The angle formed between two perpendicular lines extended from the proximal and from the distal surfaces of P1. Trigonum P1 angle (B7): The angle formed between the medial and lateral sides of the trigonum of P1. Medial trigonum-Proximal P1 angle (B8): The angle formed between the medial side of the trigonum and the proximal articular surface of P1. Lateral trigonum-Proximal P1 angle (B9): The angle formed between the lateral side of the trigonum and the proximal articular surface of P1. Medial sagittal ridge Mc3- Proximal P1 angle (B11): The angle was between a line drawn to best fit the medial side of the sagittal ridge of Mc3 and a line extending along the proximal surface of P1. Lateral sagittal ridge Mc3- Proximal P1 angle (B13): The angle was between a line drawn to best fit the medial side of the sagittal ridge of Mc3 and a line extending on the proximal surface of P1. Sagittal ridge angle (B14): The angle which was between the medial and the lateral sides of the sagittal ridge of Mc3. Ratio parameters W2/W3: It was the ratio of the lateromedial width of the medial articular cavity to the lateromedial width of the lateral articular cavity of P1. W4/W5: It was the ratio of the lateromedial width of the medial sesamoid bone to the lateromedial width of the lateral sesamoid bone. W1/W6: It was the ratio of the lateromedial width of the proximal extremity of P1 to the lateromedial width of the distal extremity of Mc3. W4/W7: It was the ratio of the lateromedial width of the medial sesamoid bone to the palmar lateromedial width of the medial condyle of Mc3. W4/W7+W8: It was the ratio of the lateromedial width of the medial sesamoid bone to the palmar lateromedial width of Mc3. W5/W8: It was the ratio of the lateromedial width of the lateral sesamoid bone to the palmar lateromedial width of the lateral condyle of Mc3. W5/W7+W8: It was the ratio of the lateromedial width of the lateral sesamoid bone to the palmar lateromedial width of the Mc3. W7/W8: It was the ratio of the palmar lateromedial width of the medial condyle to the palmar lateromedial width of the lateral condyle of Mc3. W2/W7: It was the ratio of the lateromedial width of the medial articular cavity of P1 to the palmar lateromedial width of the medial condyle of Mc3. W3/W8: It was the ratio of the lateromedial width of the lateral articular cavity of P1 to the palmar lateromedial width of the lateral condyle of Mc3. W7/W6: It was the ratio of the palmar lateromedial width of the medial condyle to the lateromedial width of the distal extremity of Mc3. W8/W6: It was the ratio of the palmar lateromedial width of the lateral condyle to the lateromedial width of the distal extremity of Mc3. H1/H2: It was the ratio of the proximodistal height of the medial sesamoid bone to the proximodistal height of the lateral sesamoid bone. H1/H3: It was the ratio of the proximodistal height of the medial sesamoid bone to the proximodistal height of P1. H2/H3: It was the ratio of the proximodistal height of the lateral sesamoid bone to the proximodistal height of P1.
Figure 4. ZDP radiographs of a right fetlock of a TB showing all the linear features used for calculating the ratio parameters. (a) is the line drawn between two points placed at the most distal extent of the medial and lateral condyles of the distal extremity of P1. Intra-rater repeatability Fifteen fetlock joints were prepared and radiographed using the procedures described to achieve the ZDP. After collecting the digital radiographs from the Synapse program, they were entered into the Epona Tech Metron program (EponaTechMetron, Metron-Hoof, Version 6.06, Epona Tech LLC, USA) to measure the parameters. Each fetlock was measured twice with an interval of at least one month. All the measurements were taken by the first author to minimize inconsistency of the measurements (Kublashvili et al., 2004). Statistical analysis The WinPepi v11.22, Module PAIRsetc 3.06 software (Abramson, 2011) was used for the following analyses on each of these parameters: The repeatability coefficient was calculated. The repeatability coefficient is described in Bland and Altman (1999). There is a 95% expectation that the absolute difference between two repeat measurements will differ by less than the value of the repeatability coefficient. Lin’s concordance correlation coefficient (CCC) was estimated. Lin’s (Lin, 1989; Lin, 2000) CCC combines measures of the accuracy (or bias) and the precision of the measurements and has a maximum value of one. The CCC is the product of a bias correction factor (Cb) and Pearson’s correlation coefficient (r). Perfect agreement between the two repeat measurements would result in a regression line that has a slope of one and an intercept of zero. A value of one for Lin’s CCC indicates perfect agreement. The bias correction factor of the CCC measures the closeness of the line from this perfect line. Pearson’s correlation coefficient measures the closeness of the data around the observed regression line. Pearson’s correlation coefficient is not a measure of agreement, only a measure of linear association and hence should not solely be used to assess agreement. Even if Pearson’s correlation coefficient is one, the intercept need not be zero and the slope need not be one. Consistency of the parameters in pre and post mortem specimens Animals Two Thoroughbreds and one Standardbred horse were used. These adult horses were euthanised for reasons not related to the fetlock joints. Only five of the six forelimbs of these horses were used after euthanasia. Limb preparation, radiographing and measurements ZDP of the five fetlock joints were taken twice. The first set of fetlock radiographs was taken from the standing horses before euthanasia. After euthanasia, the five forelimbs were prepared and radiographed using procedures described above. The two sets of radiographs were collected and the parameters were measured by the first author. The experimental protocol was approved by the Animal Ethics Committee at the University of Melbourne under the ethics approval ID of 0911422.1. Statistical analysis A paired t-test was used to compare the difference between before and after euthanasia for each variable. A P-value <0.05 was considered to be statistically significant. Stata 12.1 (Stata Corp, College Station, TX) performed the analysis. |
|||||||||||||||||||||||||||||||||||||||||||||||||||||||||||||||||||||||||||||||||||||||||||||||||||||||||||||||||||||||||||||||||||||||||||||||||||||||||||
|
|
|||||||||||||||||||||||||||||||||||||||||||||||||||||||||||||||||||||||||||||||||||||||||||||||||||||||||||||||||||||||||||||||||||||||||||||||||||||||||||
|
Results |
|||||||||||||||||||||||||||||||||||||||||||||||||||||||||||||||||||||||||||||||||||||||||||||||||||||||||||||||||||||||||||||||||||||||||||||||||||||||||||
|
Dorsopalmar view at zero angle (ZDP) ZDP was achieved based on the vertical and horizontal landmarks as described in methods and presented in Figure 2. Fetlock parameters and intra-rater repeatability The repeatability statistical analysis is summarised in Table 1. From the table it can be seen that differences between repeated measurements were small. In the angular parameters, the greatest difference was in B7 (trigonum P1 angle) with a repeatability coefficient of 0.42, whereas the least difference was in B6 (P1 angle) with a repeatability coefficient of 0.05. In the ratio parameters, all the differences between the repeated measurements had repeatability coefficients of 0.002 or less. They ranged between 0.0001 and 0.002. Table 1. Intra-rater repeatability of the angular and the ratio parameters in 15 fetlocks
According to Lin’s concordance correlation coefficient (CCC) in the comparison between the two measurements, the agreement of the measurements was generally high in both angular and ratio parameters. There was almost perfect agreement of more than 0.99 in the majority of the parameters. The lowest agreement (0.955) was found between the two measurements of the W2/W7 parameter. Consistency of the parameters in pre and post mortem There were no significant differences between the two sets of measurements in all the identified parameters. B6 and H1/H3 and H2/H3 were excluded from this experiment due to missing the distal extremity of P1 from three pre-mortem radiographs. |
|||||||||||||||||||||||||||||||||||||||||||||||||||||||||||||||||||||||||||||||||||||||||||||||||||||||||||||||||||||||||||||||||||||||||||||||||||||||||||
|
|
|||||||||||||||||||||||||||||||||||||||||||||||||||||||||||||||||||||||||||||||||||||||||||||||||||||||||||||||||||||||||||||||||||||||||||||||||||||||||||
|
Discussion |
|||||||||||||||||||||||||||||||||||||||||||||||||||||||||||||||||||||||||||||||||||||||||||||||||||||||||||||||||||||||||||||||||||||||||||||||||||||||||||
|
Radiology is an essential technique for many purposes such as to prove or disprove a suggested diagnosis, and to provide more information about the severity of lesions (Butler et al., 2017). However, in terms of radiographic measurements, it is well known that radiography is highly sensitive to any movement during radiography which might consequently affect the accuracy of the measurements (Oheida et al., 2017). Orientation and distances between the x-ray machine, object and cassette were considered as the main factors which affected radiographic measurements (Curry et al., 1990; Han et al., 1994; Walter and Davies, 2001). Therefore, the current study started with considering and determining a standard DP view for fetlock radiographs and called it the ZDP. The view was carefully defined by taking into consideration the effect of the fetlock joint rotation around its axes and the difference in the joint angle between horses. Rotation around the sagittal axis was neglected because it would not have any effect on the measurements on a DP view (Yoon et al., 2001). For the vertical and horizontal axes, the vertical and horizontal landmarks were chosen to be very sensitive to any change in the orientation of the machine or the fetlock joint during radiography. The present study developed specific parameters which not only represented the fetlock conformation but also provide the opportunity to investigate the potential relationship between fetlock morphometry and some common pathologies of the joint. These parameters were selected to represent as much as possible of the fetlock morphology and were based on mechanical relationships of the features that have a high incidence of pathology. For instance, the ratios of widths of the palmar aspect of the metacarpal condyles to the widths of the sesamoid bones has been suggested to be associated with the high susceptibility of condylar fractures in the lateral side of Mc3 (Zekas et al., 1999; Radtke et al., 2003) compared with the medial side (Barr et al., 1989). Measurable fetlock parameters were optimized based on both the possibility and accuracy of detecting associated landmarks on radiographs. Fetlock parameters in the study were developed as angles and ratios in order to remove the effects of variations in body size between individual horses. Based on the statistical analysis, it was clear that there were small differences between the first and second readings in both types of parameters in which the intra-rater repeatability coefficient was sufficiently low and CCC was substantially high. Such a small variation is obviously an indication of the high repeatability and consistency in measuring these parameters. The consistency between the two readings was probably due to the selection of easily located fetlock landmarks and therefore small landmark identification errors. In addition, measurements were made by one examiner who had experience in measuring these parameters, and this would have reduced the variation between the readings. Sufficient training and experience in anatomical radiographic morphology was considered to be a significant factor in minimizing landmark identification errors and misinterpretation (Major et al., 1994; Kublashvili et al., 2004). The statistical results of the consistency of fetlock measurements in pre and post mortem horses showed insignificant differences in all the parameters except B6, H1/H3 and H2/H3. These three parameters were excluded from the consistency experiment because the distal extremity of P1 was missing from three of the five pre-mortem radiographs. Excluding those three parameters, the insignificant differences in the measurements of the other parameters on the established ZDP suggest that the developed parameters were reliable not only in the ex-vivo environment but also seem likely to be practical to measure in live horses. |
|||||||||||||||||||||||||||||||||||||||||||||||||||||||||||||||||||||||||||||||||||||||||||||||||||||||||||||||||||||||||||||||||||||||||||||||||||||||||||
|
|
|||||||||||||||||||||||||||||||||||||||||||||||||||||||||||||||||||||||||||||||||||||||||||||||||||||||||||||||||||||||||||||||||||||||||||||||||||||||||||
|
Conclusion |
|||||||||||||||||||||||||||||||||||||||||||||||||||||||||||||||||||||||||||||||||||||||||||||||||||||||||||||||||||||||||||||||||||||||||||||||||||||||||||
|
It can be concluded that the present study established a reliable method for measuring fetlock conformation in the DP plane using radiography. It was performed through developing a range of measurable parameters on an achievable specific DP view, the ZDP. These parameters may offer a way to develop a better understanding of the potential relationships between fetlock bone morphometry and pathology. Further studies, however, are obviously required to evaluate the effects of limb orientation and varied joint angles on the parameters. |
|||||||||||||||||||||||||||||||||||||||||||||||||||||||||||||||||||||||||||||||||||||||||||||||||||||||||||||||||||||||||||||||||||||||||||||||||||||||||||
|
|
|||||||||||||||||||||||||||||||||||||||||||||||||||||||||||||||||||||||||||||||||||||||||||||||||||||||||||||||||||||||||||||||||||||||||||||||||||||||||||
|
Acknowledgments |
|||||||||||||||||||||||||||||||||||||||||||||||||||||||||||||||||||||||||||||||||||||||||||||||||||||||||||||||||||||||||||||||||||||||||||||||||||||||||||
|
The authors would like to thank the Libyan government for financial support, and would also like to thank Dr. Simon Bailey for providing the opportunity to use his horses for measurements, Loryn Anderson for her assistance in radiography, Garry Anderson and Abdunaser Dayhum for advice on statistical analysis. |
|||||||||||||||||||||||||||||||||||||||||||||||||||||||||||||||||||||||||||||||||||||||||||||||||||||||||||||||||||||||||||||||||||||||||||||||||||||||||||
|
|
|||||||||||||||||||||||||||||||||||||||||||||||||||||||||||||||||||||||||||||||||||||||||||||||||||||||||||||||||||||||||||||||||||||||||||||||||||||||||||
|
Conflict of Interests |
|||||||||||||||||||||||||||||||||||||||||||||||||||||||||||||||||||||||||||||||||||||||||||||||||||||||||||||||||||||||||||||||||||||||||||||||||||||||||||
|
The authors declare no conflicts of interest in relation to this work |
|||||||||||||||||||||||||||||||||||||||||||||||||||||||||||||||||||||||||||||||||||||||||||||||||||||||||||||||||||||||||||||||||||||||||||||||||||||||||||
|
|
|||||||||||||||||||||||||||||||||||||||||||||||||||||||||||||||||||||||||||||||||||||||||||||||||||||||||||||||||||||||||||||||||||||||||||||||||||||||||||
|
References |
|||||||||||||||||||||||||||||||||||||||||||||||||||||||||||||||||||||||||||||||||||||||||||||||||||||||||||||||||||||||||||||||||||||||||||||||||||||||||||
|
|
|||||||||||||||||||||||||||||||||||||||||||||||||||||||||||||||||||||||||||||||||||||||||||||||||||||||||||||||||||||||||||||||||||||||||||||||||||||||||||
Abramson, J.H., 2011. WINPEPI updated: computer programs for epidemiologists, and their teaching potential. Epidemiologic Perspectives and Innovations 8, 1.
Anthenill, L.A., Stover, S.M., Gardner, I.A., Hill, A.E., Lee, C.M., Anderson, M.L., Barr, B.C., Read, D.H., Johnson, B.J., Woods, L.W., Daft, B.M., Kinde, H., Moore, J.D., Farman, C.A., Odani, J.S., Pesavento, P.A., Uzal, FA, Case, J.T., Ardans, A.A., 2006. Association between findings on palmarodorsal radiographic images and detection of a fracture in the proximal sesamoid bones of forelimbs obtained from cadavers of racing Thoroughbreds. American Journal of Veterinary Research 67, 858-68. Butler, J.A., Colles, C.M., Dyson, S.J., Kold, S.E., Poulos, P.W., 2017. Clinical Radiology of the Horse. Fourth Ed. Blackwell Science Ltd. Carlson W.D., Gillette E.L., 1977. Carlson's Veterinary Radiology. Third Ed. Lea and Febiger. Curry, T.S., Dowdey, J.E., Murry, R.C., Christensen, E.E., 1990. Christensen's physics of diagnostic radiology. Lippincott Williams and Wilkins. Easton, K.L., Kawcak, C.E., 2007. Evaluation of increased subchondral bone density in areas of contact in the metacarpophalangeal joint during joint loading in horses. American Journal of Veterinary Research 68, 816-821. Farrow C.S., 2005. Veterinary Diagnostic Imaging - The Horse, Elsevier Health Sciences. Han, C.M., Hurd, C.D., Kurklis, L., 1994. Practical guide to diagnostic imaging: radiography and ultrasonography. First Ed. American Veterinary Publications. Lavin, L.M., 2007. Radiography in veterinary technology. Fourth Ed. Saunders/Elsevier. Leibsle, S.R., Prichard, M.A., Morehead, J.P., Keuler, N.S., 2005. Forelimb Conformation of the Growing Thoroughbred and the Impact of Birth Weight and Parental Conformation. Proc. American Association of equine Practitioners 51, 297-298. Lin, L.I., 2000. A note on the concordance correlation coefficient. Biometrics 56, 324-325. Morgan, J.P., 1993. Techniques of veterinary radiology. Fifth Ed. Lowa State University Press: Ames. Oheida, A.H., Anderson, G.A., Alrtib, A.M., Abushhiwa, M.H., Philip, D.J., Davies, H.M.S., 2016. Carpal Parameters on Dorsopalmar Radiographs of the Equine Carpus. Journal of Veterinary Advances 6, 1258-1268. Oheida, A.H., Anderson, G.A., Alrtib, A.M., Abushhiwa, M.H., Philip, D.J. Davies, H.M.S., 2017 Effect of Limb Rotation on Radiographic Measurements of Carpal Parameters in the Equine Carpus. Journal of Veterinary Advances 7, 1392-1402. Prado J., Alberdi M., 1994. A quantitative review of the horse Equus from South America. Palaeontology 37, 459-481. Radtke, C.L., Danova, N.A., Scollay, M.C., Santschi, E.M., Markel, M.D., Da Costa Gomez, T., Muir, P., 2003. Macroscopic changes in the distal ends of the third metacarpal and metatarsal bones of Thoroughbred racehorses with condylar fractures. American Journal of Veterinary Research 64, 1110-1116. Weaver M, Barakzai S., 2010. Handbook of equine radiology. First Ed. Saunders, Edinburgh, pp. 65-78. Weller, R., Pfau, T., May, S.A., Wilson, A.M., 2006. Variation in conformation in a cohort of National Hunt racehorses. Equine Veterinary Journal 38, 616-621. Witte, S., Hunt, R., 2009. A review of angular limb deformities. Equine Veterinary Education 21, 378-387. |