|
|
Journal of Advanced Veterinary Research Volume 10, Issue 2, 2020, Pages: 105-110 www.advetresearch.com |
|

|
Relation of Leptin Gene Polymorphism to the Circulating Leptin, Insulin, Estradiol, and Progesterone Hormones in Mares with High Rump Fat |
|||||||||||||||||||||||||||||||||||||||||||||||||||||||||||||||||||||||||||||||||||||||||||||||||||||||||||||||||||||||||||||||||||||||||||||||||||||||||||||||||||||||||||||||||||||||||||||||||||||||||||||||||||||||||||||||||||||||||||||||||||||||||||||||||||||||||||||||||||||||||
|
|
|||||||||||||||||||||||||||||||||||||||||||||||||||||||||||||||||||||||||||||||||||||||||||||||||||||||||||||||||||||||||||||||||||||||||||||||||||||||||||||||||||||||||||||||||||||||||||||||||||||||||||||||||||||||||||||||||||||||||||||||||||||||||||||||||||||||||||||||||||||||||
|
Amal M. Abo El-Maaty1*, Heba I. Shafey2, Teodora Daneva3, Heba F. Hozyen1, Hazem El-Debaky1, Sally S. Alam2, Karima F. Mahrous2, Gamal A. El Sisy2 |
|||||||||||||||||||||||||||||||||||||||||||||||||||||||||||||||||||||||||||||||||||||||||||||||||||||||||||||||||||||||||||||||||||||||||||||||||||||||||||||||||||||||||||||||||||||||||||||||||||||||||||||||||||||||||||||||||||||||||||||||||||||||||||||||||||||||||||||||||||||||||
|
|
|||||||||||||||||||||||||||||||||||||||||||||||||||||||||||||||||||||||||||||||||||||||||||||||||||||||||||||||||||||||||||||||||||||||||||||||||||||||||||||||||||||||||||||||||||||||||||||||||||||||||||||||||||||||||||||||||||||||||||||||||||||||||||||||||||||||||||||||||||||||||
|
1Animal Reproduction and A.I. Dept., Veterinary Research Division, National Research Centre, Egypt. 2Cell Biology Dept., Genetic Engineering Division, National Research Centre, Egypt. 3Institute of Biology and Immunology of Reproduction, Bulgarian Academy of Sciences, Sofia, Bulgaria. |
|||||||||||||||||||||||||||||||||||||||||||||||||||||||||||||||||||||||||||||||||||||||||||||||||||||||||||||||||||||||||||||||||||||||||||||||||||||||||||||||||||||||||||||||||||||||||||||||||||||||||||||||||||||||||||||||||||||||||||||||||||||||||||||||||||||||||||||||||||||||||
|
|
|||||||||||||||||||||||||||||||||||||||||||||||||||||||||||||||||||||||||||||||||||||||||||||||||||||||||||||||||||||||||||||||||||||||||||||||||||||||||||||||||||||||||||||||||||||||||||||||||||||||||||||||||||||||||||||||||||||||||||||||||||||||||||||||||||||||||||||||||||||||||
|
Received: 19 February 2020; Accepted: 31 March 2020 (*Corresponding author: amalaboelmaaty1@yahoo.com) |
|||||||||||||||||||||||||||||||||||||||||||||||||||||||||||||||||||||||||||||||||||||||||||||||||||||||||||||||||||||||||||||||||||||||||||||||||||||||||||||||||||||||||||||||||||||||||||||||||||||||||||||||||||||||||||||||||||||||||||||||||||||||||||||||||||||||||||||||||||||||||
|
|
|||||||||||||||||||||||||||||||||||||||||||||||||||||||||||||||||||||||||||||||||||||||||||||||||||||||||||||||||||||||||||||||||||||||||||||||||||||||||||||||||||||||||||||||||||||||||||||||||||||||||||||||||||||||||||||||||||||||||||||||||||||||||||||||||||||||||||||||||||||||||
|
Abstract |
|||||||||||||||||||||||||||||||||||||||||||||||||||||||||||||||||||||||||||||||||||||||||||||||||||||||||||||||||||||||||||||||||||||||||||||||||||||||||||||||||||||||||||||||||||||||||||||||||||||||||||||||||||||||||||||||||||||||||||||||||||||||||||||||||||||||||||||||||||||||||
|
|
|||||||||||||||||||||||||||||||||||||||||||||||||||||||||||||||||||||||||||||||||||||||||||||||||||||||||||||||||||||||||||||||||||||||||||||||||||||||||||||||||||||||||||||||||||||||||||||||||||||||||||||||||||||||||||||||||||||||||||||||||||||||||||||||||||||||||||||||||||||||||
|
Equine metabolic syndrome is a growing concern usually associated with increased insulin and leptin concentrations. To investigate the relations of obesity determined by measuring the rump fat (RF) with ovarian hormones, leptin, and leptin gene polymorphism, cyclic mares (n=36) were categorized based on RF thickness estimated by the ultrasonography and body condition score (BCS) into obese (RF>5mm; BCS >5), moderate (RF>3≤5 mm;BCS >3≤5) and lean animals (RF<3mm; BCS<3). The circulating estradiol, progesterone, insulin, and leptin were analyzed. The polymorphism of the leptin gene was performed and compared for obese, moderate and lean mares. Depending on increased RF, the obesity was associated with increased BCS (P<0.0001) and leptin (P<0.0001), insulin (P<0.01), and P4 (P<0.0001). Obese mares of leptin genotype BB had the highest leptin (1146±420 pg/ml), insulin (7.42±0.89 μU/l) and progesterone (22.69±9.34 ng/ml), but minimum estradiol (101±54 pg/ml) concentrations. Mares of leptin genotype AA had the highest RF (P<0.0001). The interaction of leptin genotype and obesity had affected RF and all hormone concentrations with no significant effect on the BCS. In conclusion, obesity in cyclic mares altered ovarian hormones, insulin and leptin concentrations. The hyperleptinemia, and hyperinsulinemia were associated with the leptin genotype BB but neither to the adiposity (RF) nor BCS. |
|||||||||||||||||||||||||||||||||||||||||||||||||||||||||||||||||||||||||||||||||||||||||||||||||||||||||||||||||||||||||||||||||||||||||||||||||||||||||||||||||||||||||||||||||||||||||||||||||||||||||||||||||||||||||||||||||||||||||||||||||||||||||||||||||||||||||||||||||||||||||
|
|
|||||||||||||||||||||||||||||||||||||||||||||||||||||||||||||||||||||||||||||||||||||||||||||||||||||||||||||||||||||||||||||||||||||||||||||||||||||||||||||||||||||||||||||||||||||||||||||||||||||||||||||||||||||||||||||||||||||||||||||||||||||||||||||||||||||||||||||||||||||||||
|
Keywords: Adiposity, Leptin Hormone, Leptin Gene Polymorphism, Mare, Ovarian Hormones |
|||||||||||||||||||||||||||||||||||||||||||||||||||||||||||||||||||||||||||||||||||||||||||||||||||||||||||||||||||||||||||||||||||||||||||||||||||||||||||||||||||||||||||||||||||||||||||||||||||||||||||||||||||||||||||||||||||||||||||||||||||||||||||||||||||||||||||||||||||||||||
|
|
|||||||||||||||||||||||||||||||||||||||||||||||||||||||||||||||||||||||||||||||||||||||||||||||||||||||||||||||||||||||||||||||||||||||||||||||||||||||||||||||||||||||||||||||||||||||||||||||||||||||||||||||||||||||||||||||||||||||||||||||||||||||||||||||||||||||||||||||||||||||||
|
Introduction |
|||||||||||||||||||||||||||||||||||||||||||||||||||||||||||||||||||||||||||||||||||||||||||||||||||||||||||||||||||||||||||||||||||||||||||||||||||||||||||||||||||||||||||||||||||||||||||||||||||||||||||||||||||||||||||||||||||||||||||||||||||||||||||||||||||||||||||||||||||||||||
|
|
|||||||||||||||||||||||||||||||||||||||||||||||||||||||||||||||||||||||||||||||||||||||||||||||||||||||||||||||||||||||||||||||||||||||||||||||||||||||||||||||||||||||||||||||||||||||||||||||||||||||||||||||||||||||||||||||||||||||||||||||||||||||||||||||||||||||||||||||||||||||||
|
Obesity in horses produce serious health concerns that occurs due to excessive accumulation of body fats (Huff, 2007; Henry and Clarke, 2008; Huff et al., 2010). Adipose tissue secretes adipokines and inflammatory proteins, which impact health. Leptin is a 16-kDa polypeptide hormone secreted from the white adipose tissue in response to the change in body fat or energy status (Chilliard et al., 2005). It regulates several immune functions and fertility (Akumbugu and Zanwa, 2017). Leptin increased in the plasma of obese horses (Gentry et al., 2002), and was used an important biomarker to estimate body fat mass (Van Weyenberg et al., 2008). In horses, leptin concentration was related to body condition, age, gender, and season (Fitzgerald and McManus, 2000; Gentry et al., 2002; Cartmill, 2004). The concentration of leptin increased with the increase of body fat percentage (Chilliard et al., 2000), and body condition (Gentry et al., 2002; Cartmill et al., 2003). High body condition score (BCS) was associated with perturbations in leptin secretion and altered both ovarian activity and the estrous cycle (Waller et al., 2006). The restriction and excess of calorie in the diet motivated leptin to repress gonadotroph signaling (Gao and Horvath, 2008). The regional adiposity, hyperinsulinemia, hypertriglyceridemia, insulin resistance, and recurrent laminitis were the main phenotypic markers of equine metabolic syndrome (Geor and Frank, 2009; Frank et al., 2010). Leptin gene is located on chromosome 4 in the horse and consists of 3 exons and 2 introns, with only two exons are (expressed) translated into protein (Huff et al., 2009). The relation between leptin gene polymorphisms and with circulating leptin level and obesity were identified (Amiratul et al., 2018). In equine, polymorphism of the leptin gene was related to the reproductive performance (Bohaczyk et al., 2011), and showed no significant difference between cortisol concentration and age in stressed horses during endurance competition (Rezazadeh et al., 2016). The aim of this study was to investigate the relation between adiposity characterized by increased rump fat (RF) and BCS in mares with circulating leptin, insulin, ovarian hormones, and leptin gene polymorphism. |
|||||||||||||||||||||||||||||||||||||||||||||||||||||||||||||||||||||||||||||||||||||||||||||||||||||||||||||||||||||||||||||||||||||||||||||||||||||||||||||||||||||||||||||||||||||||||||||||||||||||||||||||||||||||||||||||||||||||||||||||||||||||||||||||||||||||||||||||||||||||||
|
|
|||||||||||||||||||||||||||||||||||||||||||||||||||||||||||||||||||||||||||||||||||||||||||||||||||||||||||||||||||||||||||||||||||||||||||||||||||||||||||||||||||||||||||||||||||||||||||||||||||||||||||||||||||||||||||||||||||||||||||||||||||||||||||||||||||||||||||||||||||||||||
|
Materials and methods |
|||||||||||||||||||||||||||||||||||||||||||||||||||||||||||||||||||||||||||||||||||||||||||||||||||||||||||||||||||||||||||||||||||||||||||||||||||||||||||||||||||||||||||||||||||||||||||||||||||||||||||||||||||||||||||||||||||||||||||||||||||||||||||||||||||||||||||||||||||||||||
|
Animals Thirty six mares from different breeds (Arabian, European, and native) were used in the present work. Animals were in good health and with clinically normal reproductive tracts and their ages ranged from 4 to18 years old. Mares were raised on the Equestrian Club (El Basateen), belongs to the Police Department, Ministry of Interior, Egypt. Animals were fed their requirements of pelleted ration with free access to mineral salt blocks, water, regularly exercised and dewormed. Animals were examined and sampled in accordance to the Institutional Animal Care and Use Committee of the National Research Centre, Egypt. Experimental design Mares were divided into three groups according to the rump fat measurements (Abo El-Maaty et al., 2017) and body condition score (Henneke et al., 1983); obese (rump fat >5mm and BCS >5), moderate animals (rump fat >3≤5 mm and BCS >3≤5) and lean animals (rump fat <3mm and BCS <3). Ultrasound examination The ultrasound scanner (SonoAceR3, Medison, Samsung, South Korea) was used to measure rump fat depth, count the number and diameter of ovarian follicles, determine the diameter of the corpus luteum and also to exclude pregnancy. Blood sampling Blood samples were collected in plain vacuum tubes, then sera were harvested. Blood for leptin Gene polymorphism was collected in vacuum tubes containing EDTA and all were stored at -20°C until molecular genetic analysis and hormone assaying were performed. Hormone assaying Horse ELISA leptin and insulin sandwich kits (Bioneovan Co., China), progesterone (P4) and estradiol (E2 DRG, Instruments GmbH, Germany) were assayed with minimum detectable concentrations, which were 35 pg/ml for leptin, 0.3 μU/L for insulin 0.045 ng/ml for P4, and 9.714 pg/ml for E2. The intra-and inter-assay precisions were <10% and <12%, for both leptin and insulin; 5.4% and 9.96% for P4, and 6.81 and 7.25% for E2. Genomic DNA extraction and PCR amplification Genomic DNA was isolated by the salting out method (Paneto et al., 2008). DNA concentration and purity were evaluated in a spectrophotometer (Nanodrop 2000c, Thermo Scientific, USA) and DNA quality was checked by 1.0% agarose gel electrophoresis before PCR amplification. According to the sequence of the horse leptin gene (GenBank Accession NO NC_009147.2 (Caetano et al., 1999) one pair of polymerase chain reaction (PCR) primers (forward: 5'-GTCACCAGGATCAATGACAT-3 'and reverse: 5'-AGCCCAGGAATGAAGTCCAA-3') was designed to amplify a 1900 bp fragment of leptin where exon 2 and 3 separated with intron 2. A PCR cocktail consisted of 1.0 M upper and lower primers, 0.2 mM dNTPs and 1.25U of Taq polymerase. The cocktail was aliquot into PCR tubes with 50 ng of horse DNA. The PCR thermal profile was as follows: initial denaturation of DNA matrix for 5 min at 94°C, followed by 35 cycles: proper denaturation at 94°C (1min), primer annealing at 58°C (1 min), PCR product synthesis at 72°C (2 min) and final synthesis at 72°C for 10 min. The PCR products were loaded onto 1.5% agarose to confirm the amplification of the target region using a 100bp marker. Genotyping Restriction fragment length polymorphism (RFLP) analysis of the PCR product (Mahrous et al., 2020) was carried out using TaqI enzyme (Fermentas). Ten ul of PCR products were digested with 1ul of FastDigest restriction enzymes for 5 min at 65°C. The digested PCR fragments were subjected to electrophoresis in 2% agarose/ethidium bromide gel (GIBCO, BRL, England) in 1x TBE buffer (0.09 M Tris-boric acid and 0.002 M EDTA). Gels were visualized under UV light and documented in FX Molecular Imager apparatus (BIO-RAD). LEP gene analysis results were elaborated statistically using GENEPOP software package (Raymond and Rousset, 1995). The genetic structure, utility types, the frequency of leptin genotypes (LEP/TaqI) and the frequency of respective alleles were calculated. Statistical analysis For comparing allelic and genotype frequencies between the horse breeds and utility types examined, χ2 test was applied to evaluate the significant of differences between the values obtained for particular genotypes and alleles. Simple One Way ANOVA was used and the Duncan’s multiple range tests were performed using SPSS (2016). |
|||||||||||||||||||||||||||||||||||||||||||||||||||||||||||||||||||||||||||||||||||||||||||||||||||||||||||||||||||||||||||||||||||||||||||||||||||||||||||||||||||||||||||||||||||||||||||||||||||||||||||||||||||||||||||||||||||||||||||||||||||||||||||||||||||||||||||||||||||||||||
|
|
|||||||||||||||||||||||||||||||||||||||||||||||||||||||||||||||||||||||||||||||||||||||||||||||||||||||||||||||||||||||||||||||||||||||||||||||||||||||||||||||||||||||||||||||||||||||||||||||||||||||||||||||||||||||||||||||||||||||||||||||||||||||||||||||||||||||||||||||||||||||||
|
Results |
|||||||||||||||||||||||||||||||||||||||||||||||||||||||||||||||||||||||||||||||||||||||||||||||||||||||||||||||||||||||||||||||||||||||||||||||||||||||||||||||||||||||||||||||||||||||||||||||||||||||||||||||||||||||||||||||||||||||||||||||||||||||||||||||||||||||||||||||||||||||||
|
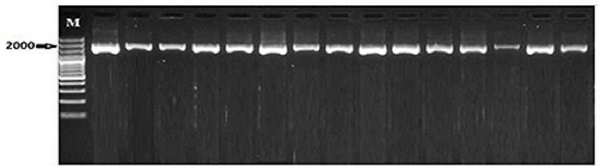
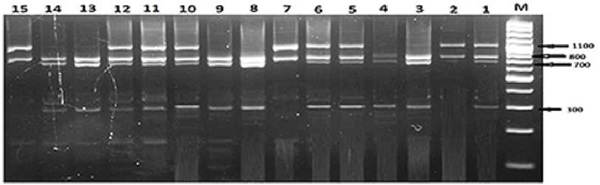
The PCR amplification of leptin gene yielded about 1900 bp long fragment (Fig.1). This amplified fragment was digested with the TaqI restriction enzyme and results in homozygous AA genotype with two restriction fragments of ~1040 and ~820 bp, heterozygous AB genotype with four fragments at ~1040, ~820, ~740 and ~300 bp for, and homozygous BB genotype with three fragments at ~820, ~740 and ~300 bp (Fig. 2). The frequency of allele B (0.734) was higher (P=0.0001) in the whole population as compared with allele A (0.266). The values of allele A frequency were increasing with the increase of RF and BCS 0.133, 0.294 and 0.357 but those of allele B were decreasing with the increase of RF and BCS (0.869, 0.708, and 0.643) from lean to moderate and obese horses, respectively. The genotypic frequency of the homozygous genotype BB is high (P=0.001) in lean mares (0.82) as compared with moderate (0.576) and obese (0.507) mares. Contrary, the genotypic frequency of the homozygous genotype AA was low (P=0.002) in lean (0.083) in comparison to moderate (0.162) and obese mare (0.221; Table1). Table 1. Leptin genotype and allele frequencies (%) in mare’s populations with different body conditions
*: P< 0.01; **: P< 0.001 Table 2. Values of rump fat (RF), BCS, leptin and ovarian hormones in obese, moderate and lean mares with different genotypes
Data were expressed as Mean±SD Means with different superscripts (a,b,c) are significantly different at P<0.05; non-significant (NS); rump fat (RF); body condition score(BCS); progesterone (P4); estradiol(E2).
Fig. 1. Detection of PCR products all Lanes of leptin gene in mares on 2% agarose gel electrophoresis. Allele size was about 1900 bp. M: 100 bp DNA ladder marker.
Fig. 2. Three different genotypes obtained after digestion of PCR products of leptin gene with TaqI. Lane M: 100 bp ladder marker. Lane 2, 7 and 15: Homozygous genotype AA, Lanes 1, 5, 6, 10,11and 12: Heterozygous genotype AB, Lanes 3, 4, 8, 9, 13 and 14: Homozygous genotype BB. In the obese mares (Table 2), though mares with genotype BB had the lowest (P=0.0001) RF (5.08±0.58), E2 (101±54), but they had the highest P4 (P=0.012; 22.69±9.34), insulin (P=0.0001; 7.42±0.89), and leptin (P=0.0001; 1146±420). The obese mares with genotype AA had the highest RF (P=0.0001; 8.10±1.39), E2 (P=0.0001; 257±22), and BCS (6.85±0.96), the lowest leptin (P=0.0001; 101±55), and nearly similar insulin and P4 to the heterogeneous obese mares of leptin genotype AB (Table 2). Within lean mares, those with leptin genotype AA had the highest (P=0.0001) RF (2.99±0.09), P4 (P=0.027; 17.24±8.18), and leptin (P=0.0001; 234±15), but the lowest E2 (P=0.018; 102±6). When all mares were classified according to their leptin genotype (Table 3), mares with the genotype AA had the highest (P=0.0001) RF (6.06±2.62), BCS (5.92±1.49), and P4 (P=0.048; 19.89±9.92), but low leptin (121±66). Although mares with leptin genotype BB had the minimum RF (P=0.0001; 3.82±1.43), BCS (P=0.0001; 4.97±1.73), P4 (P=0.0458 17.11±8.91), but they had the highest leptin (P=0.0001; 635±593) and insulin (P=0.0001; 5.17±5.72) concentrations. Table 3. Values of BCS, Rump fat thickness and hormone concentrations in mares with different leptin genotypes
Data were expressed as Mean±SD Means with different superscripts (a,b,c) are significantly different at P<0.05; NS: Non significant Regardless leptin genotyping (Table 4), RF thickness descended from obese mares (7.24±2.39) (P=0.0001), to moderate (4.48±1.03), and then to lean mares (2.12±0.53). BCS of obsess mares is high (P=0.0001; 6.92±0.83) in contrast to moderate (5.41±1.07), and lean mares (3.43±1.18). Leptin concentrations of obese mares is the highest (P=0.0001; 356±486) when compared to moderate (201±236), and lean mares (196±154). P4 concentrations descended linearly (P=0.0001) from obese (20.97±9.53), to moderate (18.07±9.41), and lean ones (14.28±8.18). Obese mares obtained the lowest E2 concentrations (P=0.0001; 159±143) and the highest insulin concentrations (P=0.01; 4.08±4.28). Table 4. Values of BCS, rump fat thickness and hormone concentrations in mares with different rump fat thickness
Data were expressed as Mean±SD Body condition score (BCS), rump fat (BF). Means with different superscripts (a,b,c) are significantly different at P<0.05. Leptin genotype (Table 5) showed significant effects (P<0.0001) on RF(P<0.0001), BCS(P<0.0001), leptin (P<0.0001), insulin (P<0.005), P4 (P<0.0001), and E2(P=0.048) in mares. The obesity depending on increased rump fat showed significant effects (P=0.0001) on RF, BCS, leptin, insulin, and E2. The interactions of leptin genotype and obesity affected RF (P<0.008), leptin (P<0.0001), insulin(P<0.0001), P4 (P<0.0001), and E2 (P<0.0001). Table 5. The effect of obesity, leptin genotype and their interactions on BCS, Rump Fat and circulating hormones in mares
NS: Non significant Leptin (r=0.17; P=0.023), correlated with BCS of obese mares and moderate mares (r=0.32; P=0.0001), but has a negative one with RF of obese mares only. (r=-0.54; P=0.0001). Insulin correlated negatively with BCS (r=-0.33; P=0.0001), RF (r=-0.21; P=0.003) of obese mares, and RF (r=-0.36; P=0.031) of lean mares but positively with BCS of lean mares (r=0.46; P=0.0001). |
|||||||||||||||||||||||||||||||||||||||||||||||||||||||||||||||||||||||||||||||||||||||||||||||||||||||||||||||||||||||||||||||||||||||||||||||||||||||||||||||||||||||||||||||||||||||||||||||||||||||||||||||||||||||||||||||||||||||||||||||||||||||||||||||||||||||||||||||||||||||||
|
|
|||||||||||||||||||||||||||||||||||||||||||||||||||||||||||||||||||||||||||||||||||||||||||||||||||||||||||||||||||||||||||||||||||||||||||||||||||||||||||||||||||||||||||||||||||||||||||||||||||||||||||||||||||||||||||||||||||||||||||||||||||||||||||||||||||||||||||||||||||||||||
|
Discussion |
|||||||||||||||||||||||||||||||||||||||||||||||||||||||||||||||||||||||||||||||||||||||||||||||||||||||||||||||||||||||||||||||||||||||||||||||||||||||||||||||||||||||||||||||||||||||||||||||||||||||||||||||||||||||||||||||||||||||||||||||||||||||||||||||||||||||||||||||||||||||||
|
Leptin is one of the mediators that influence the effects of the body weight on fertility. Furthermore, the decreased body fat was associated with decreased leptin levels in horses showing impaired reproductive efficiency (Gentry et al., 2002). Allele frequency in the present study revealed that allele B was higher than allele A in all studied groups. In consistent with our study, the greatest frequency in the BB LEP/TaqI homozygous was also observed with a higher percentage of participation of leptin AB heterozygous animals in comparing with the AA homozygous ones in mares (Kęszka, 2006) and Polish cold-blooded horses (Bohaczyk et al., 2011). Similar to cold blooded Polish horses, the LEP/TaqI frequencies of the gene AA and allele A were the lowest, and the allele B had the highest frequency (Bohaczyk et al., 2011). In the study of Bohaczyk et al. (2011), the frequency of the allele B (0.6108) was higher than the allele A (0.3892) for the whole horse population. In contrast to our results, the frequency of the heterozygous leptin gene AB (0.4897) was the highest, followed by BB (0.3660), whereas the identical allell AA was the lowest (0.1443, Kęszka, 2006). Similarly, the heterozygotic genotype had the most favorable reproductive indices but the other homozygotic group (AA) had the lowest reproductive indices with no significant difference in the Polish cold blood mares that had identical frequencies of alleles A and B (Bohaczyk et al., 2011). As well as, any connection between the leptin genotype and the reproduction indices were found in studied mares (Liefers et al., 2002). Moreover, the DNA of hyperleptinemic and those with normal high body condition revealed that no polymorphism in exon 2 of the equine leptin gene; therefore, polymorphism was not a likely explanation for the high vs. low leptin difference (Huff, 2007). Leptin concentration increased from the deviation of the dominant follicle till the day of ovulation, during corpus luteum development till the selection of the next ovulating follicle, and before the foal heat (Abo El-Maaty and Gabr, 2010; Abdelnaby and Abo El-Maaty, 2017; Abo El-Maaty and Abdelnaby, 2017). The increased concentration of blood leptin with increased body condition score and back fat could be attributed to the fact that leptin circulates in the blood at concentrations parallels to the amount of adiposity, which is directly correlated to the body mass index and the percentage of body fat in horses (Kearns et al., 2006). The altered adiposity in horses with EMS is associated with elevated leptin (Kearns et al., 2006). The increased progesterone in obese mares in this study was also observed in obese mares with elevated systemic leptin and increased progesterone, which was referred to lengthened inter-ovulatory intervals and lengthened luteal phases (Vick et al., 2006). Contrary to the decreased BCS and leptin concentration in mares with inactive ovaries and anovulation (Gentry et al., 2002), the decreases of RF, BCS and leptin were associated with high E2 level. In agreement with the decreased E2 and increased P4 concentrations that observed in obese mares of this study, obesity was associated with altered estrous cycles and anovulation of the dominant follicles (Sessions-Bresnahan et al., 2004; Vick et al., 2006). In mares, the increase of leptin level, which was recorded during the foal heat (Abo El-Maaty and Gabr, 2010) and at the day of ovulation (Abdelnaby and Abo El-Maaty, 2017; Abo El-Maaty and Abdelnaby, 2017) explain its role during ovulation but the increases in leptin and insulin levels in obese mares (in this study) above the physiological values may inhibit ovulation and disturb steroideogenesis (Terranova and Rice, 1997), which indicated by decreased E2 level. The decrease of E2 with increase of leptin concentrations in the investigated obese mares may refer to the interference of hyperleptinemia with gonadotropin stimulation of peripheral target and this high leptin environment was keeping the ovary from overproducing estradiol via leptin inhibition of steroidogenesis (Durward-Akhurst et al., 2018). In obese women, high leptin levels had the potential to interfere with estradiol production by the dominant follicle in vivo, either directly or through a reduction of the androgenic substrate derived by theca cells (Chu et al., 2008). Elevated leptin levels may be interfered with the development of the dominant follicle, reduced estradiol production, within adequate stimulus for LH secretion resulted in anovulation (Gao and Horvath, 2008). As well as, high physiological concentrations of leptin could significantly interfere with the ability of the dominant follicle to produce estradiol, both by inhibiting the production of androgen substrate and by decreasing the aromatizing capacity of granulose cells (Gentry et al., 2002; Waller et al., 2006; Huff, 2007). In the ovary, leptin was reported to impair the IGF-I mediated augmentation of estradiol synthesis by granulosa cells (Waller et al., 2006; Huff,2007; Gao and Horvath, 2008) by acting centrally to stimulate pituitary gonadotropin secretion, in addition to the peripheral leptin receptors exposed to high concentrations, which produced a negative effect on gonadal steroidogenesis (Orr, 2016). The hyperleptinemia of obese and moderate mares with leptin genotype BB was associated with minimum E2 level and hypoleptinemia in obese and moderate mares with leptin genotype AA associated with high E2 level, which may indicate the presence of a specific and narrow range of leptin concentrations to maintain normal reproductive functions and that concentrations below or above these thresholds interfered in opposing ways with the function of the hypothalamic-pituitary-gonadal axis (Orr, 2016). The differences in ovarian hormones between mares of different rump fat, leptin genotype and concentrations of this study conform with its role in regulating body weight and acting as mediators of many physiological functions (Henson and Castracane, 2003), and agreed with the rise of plasma leptin concentration in horses with high body fat mass (Cartmill et al., 2003). |
|||||||||||||||||||||||||||||||||||||||||||||||||||||||||||||||||||||||||||||||||||||||||||||||||||||||||||||||||||||||||||||||||||||||||||||||||||||||||||||||||||||||||||||||||||||||||||||||||||||||||||||||||||||||||||||||||||||||||||||||||||||||||||||||||||||||||||||||||||||||||
|
|
|||||||||||||||||||||||||||||||||||||||||||||||||||||||||||||||||||||||||||||||||||||||||||||||||||||||||||||||||||||||||||||||||||||||||||||||||||||||||||||||||||||||||||||||||||||||||||||||||||||||||||||||||||||||||||||||||||||||||||||||||||||||||||||||||||||||||||||||||||||||||
|
Conclusion |
|||||||||||||||||||||||||||||||||||||||||||||||||||||||||||||||||||||||||||||||||||||||||||||||||||||||||||||||||||||||||||||||||||||||||||||||||||||||||||||||||||||||||||||||||||||||||||||||||||||||||||||||||||||||||||||||||||||||||||||||||||||||||||||||||||||||||||||||||||||||||
|
This study concluded that obese mares have high BCS, back fat, P4 level, and leptin level but low E2 level. The leptin genotype BB was more frequent but not in obese mares with high leptin level, whereas the leptin genotype AA was less frequent but characterized by having high BCS, back fat with low leptin level, suggesting that these polymorphisms has no effect on mares’ body weight. |
|||||||||||||||||||||||||||||||||||||||||||||||||||||||||||||||||||||||||||||||||||||||||||||||||||||||||||||||||||||||||||||||||||||||||||||||||||||||||||||||||||||||||||||||||||||||||||||||||||||||||||||||||||||||||||||||||||||||||||||||||||||||||||||||||||||||||||||||||||||||||
|
|
|||||||||||||||||||||||||||||||||||||||||||||||||||||||||||||||||||||||||||||||||||||||||||||||||||||||||||||||||||||||||||||||||||||||||||||||||||||||||||||||||||||||||||||||||||||||||||||||||||||||||||||||||||||||||||||||||||||||||||||||||||||||||||||||||||||||||||||||||||||||||
|
Conflict of Interests |
|||||||||||||||||||||||||||||||||||||||||||||||||||||||||||||||||||||||||||||||||||||||||||||||||||||||||||||||||||||||||||||||||||||||||||||||||||||||||||||||||||||||||||||||||||||||||||||||||||||||||||||||||||||||||||||||||||||||||||||||||||||||||||||||||||||||||||||||||||||||||
|
|
|||||||||||||||||||||||||||||||||||||||||||||||||||||||||||||||||||||||||||||||||||||||||||||||||||||||||||||||||||||||||||||||||||||||||||||||||||||||||||||||||||||||||||||||||||||||||||||||||||||||||||||||||||||||||||||||||||||||||||||||||||||||||||||||||||||||||||||||||||||||||
|
The authors declare that they don’t have any conflict of interest. |
|||||||||||||||||||||||||||||||||||||||||||||||||||||||||||||||||||||||||||||||||||||||||||||||||||||||||||||||||||||||||||||||||||||||||||||||||||||||||||||||||||||||||||||||||||||||||||||||||||||||||||||||||||||||||||||||||||||||||||||||||||||||||||||||||||||||||||||||||||||||||
|
|
|||||||||||||||||||||||||||||||||||||||||||||||||||||||||||||||||||||||||||||||||||||||||||||||||||||||||||||||||||||||||||||||||||||||||||||||||||||||||||||||||||||||||||||||||||||||||||||||||||||||||||||||||||||||||||||||||||||||||||||||||||||||||||||||||||||||||||||||||||||||||
|
References |
|||||||||||||||||||||||||||||||||||||||||||||||||||||||||||||||||||||||||||||||||||||||||||||||||||||||||||||||||||||||||||||||||||||||||||||||||||||||||||||||||||||||||||||||||||||||||||||||||||||||||||||||||||||||||||||||||||||||||||||||||||||||||||||||||||||||||||||||||||||||||
|
|
|||||||||||||||||||||||||||||||||||||||||||||||||||||||||||||||||||||||||||||||||||||||||||||||||||||||||||||||||||||||||||||||||||||||||||||||||||||||||||||||||||||||||||||||||||||||||||||||||||||||||||||||||||||||||||||||||||||||||||||||||||||||||||||||||||||||||||||||||||||||||
Abdelnaby, E.A., Abo El-Maaty, A.M., 2017. Dynamics of follicular blood flow, antrum growth and angiogenic mediators in mares from deviation to ovulation. J. Equine Vet. Sci. 55, 51-59.
Abo El-Maaty, A.M., Abdelnaby, E.A., 2017. Follicular blood flow, antrum growth and angiogenic mediators in mares from ovulation to deviation. Anim. Reprod. 14, 1043-1056.
Abo El-Maaty, A.M., Gabr, F.I., 2010. Relation between leptin and estradiol levels in Egyptian lactating Arab mares during foaling heat. Anim. Reprod. Sci.117, 95-98.
Abo El-Maaty, A.M., Mohamed, A.H., Abu-Aita, N.A., Morgan, H.M., 2017. Markers for Predicting Overweight or Obesity of Broodmares. J. Equine Vet. Sci. 56, 9-18. Akumbugu, F.E., Zanwa, A.I., 2017. Diversity study analysis of leptin gene in some ruminant and non-ruminant selected animal species. Biotechnol. Anim. Husbandry 33, 261-270. Amiratul, A.S., Aryati, A., Wan, R.W.T., 2018. Haplotype analysis of leptin gene polymorphisms in obesity among Malays in Terengganu, Malaysia population. Med. J. Malaysia 73, 281-285. Bohaczyk, M., Wiśniewska, E., Mroczkowski, S., 2011. The relationship between the leptin gene polymorphism and reproduction indices in polish cold blood mares. J. Central European Agric. 12, 445-452. Caetano, A.R.; Pomp, D.; Murray, J.D.; Bowling, A.T., 1999. Comparative mapping of 18 equine type I genes assigned by somatic cell hybrid analysis. Mam. Genome 10, 271-276. Cartmill, J.A., 2004. Leptin in horses, influences of body condition, gender, insulin insensitivity, feeding, and dexamethasone. PhD Dissertation, Louisiana State University, Baton Rouge. Cartmill, J.A., Thompson Jr, D.L., Storer, W.A., Gentry, L.R., Huff, N.K., 2003. Endocrine responses in mares and geldings with high body condition scores grouped by high versus low resting leptin concentrations. J. Anim. Sci. 81, 2311–2321. Chilliard, Y., Delavaud, C., Bonnet, M., 2005.Leptin expression in ruminants, nutritional and physiological regulations in relation with energy metabolism. Domest. Anim. Endocrinol. 29, 3-22. Chilliard, Y., Ferlay, A., Faulconnier, Y., Bonnet, M., Rouel, J., Bocquier, F., 2000. Adipose tissue metabolism and its role in adaptations to undernutrition in ruminants. Proc. Nutr. Soc. 59, 127–134. Chu, M.C., Cushman, M., Solomon, R., Lobo, R.A., 2008. Metabolic syndrome in postmenopausal women, The influence of oral or transdermal estradiol on inflammation and coagulation markers. Am. J. Obstet. Gynecol. 199, 526e1-526e7. Durward-Akhurst, S.A., Schultz, N.E., Norton, E.M., Rendahl, A.K., Besselink, H., Behnisch, P.A., Brouwer, A., Geor, R.J., Mickelson, J.R., McCue, M.E., 2018. Associations between endocrine disrupting chemicals and equine metabolic syndrome phenotypes. Chemosphere 218, 652-661. Fitzgerald. B.P., McManus, C.J., 2000. Photoperiodic versus metabolic signals as determinants of seasonal anestrus in the mare. Biol. Reprod. 63, 335-340. Frank, N., Geor, R.J., Bailey, S.R., Durham, A.E., Johnson, P.J., 2010. Equine metabolic syndrome. J. Vet. Intern. Med. 24, 467-475. Gao, Q, Horvath, T.L., 2008. Cross-talk between estrogen and leptin signaling in the hypothalamus. Am. J. Physiol. Endocrinol. Metab. 294, E817–E826. Gentry, L.R., Thompson, D.L., Gentry, G.T. Jr, Davis, K.A., Godke, R.A., Cartmill, J.A., 2002. The relationship between body condition, leptin, and reproductive and hormonal characteristics of mares during the seasonal anovulatory period. J. Anim. Sci. 80, 2695-2703. Geor, R., Frank, N., 2009. Metabolic syndrome-from human organ disease to laminar failure in equids. Vet. Immunol. Immunopathol. 129, 151-154. Henneke, D., Potter, G., Kreider, J., Yeates, B., 1983. Relationship between condition score, physical measurements and body fat percentage in mares. Equine Vet. J.15, 371‐372. Henry, B.A., Clarke, I.J., 2008. Adipose tissue hormones and the regulation of food intake. J. Neuroendocrinol. 20, 842-849. Henson, M.C., Castracane, V.D., 2003. Leptin and Reproduction. Plenum Publishers, New York, NY. Huff, N.K., 2007. Equine obesity-related hyperleptinemia. Louisiana State University and Agricultural and Mechanical College. LSU Doctoral Dissertations, htps,// digitalcommons. lsu.edu/ gradschool_dissertations /1353. Huff, N.K, Thompson, D.L. Jr, Bondioli, K.R., 2009. Search for Polymorphism in Exon 2 of the Equine Leptin Gene. J Equine Vet Sci. 29, 519-526. Huff, N.K., Thompson, D.L. Jr, Mitcham, P.B., Storer, W.A., 2010. Hyperleptinemia in horses, responses to administration of a small dose of lipopolysaccharide endotoxin in mares and geldings. J. Anim. Sci. 88, 926-936. Kearns, C.F., McKeever, K.H., Roegner, V., Brady, S.M., Malinowski, K., 2006. Adiponectin and leptin are related to fat mass in horses. Vet. J. 172, 460-465. Kęszka, A., 2006. Próbaokreśl eniazale żnościp omiędzy polimorfzmem w genie leptyn yiwy branych białekkrwi a wsk aźnikamirozro duklaczy stadnych. Pracadoktorska (maszynopis). AR Szczecin. Liefers, S., Pas, M.T., Veerkamp, R., Lende, T.V.D., 2002. Associations between leptin gene polymorphisms and production, live weight, energy balance, feed intake, and fertility in holstein heifers. J. Dairy Sci. 85, 1633-1638. Mahrous, K.F., Aboelenin, M.M., Rashed, M.A., Sallam, M.A., Rushdi, H.E., 2020. Detection of polymorphism within leptin gene in Egyptian river buffalo and predict its effects on different molecular levels. J. Genet Eng. Biotechnol. 18, 6. Orr, C., 2016. Relationship among genetic and physiological biomarkers, and horse characteristics. Theses and Dissertations, 1788. University of Arkansas, Fayetteville. USA http,//scholarworks.uark.edu/etd/1788. Paneto, J.C., Ferraz, J.B., Balieiro, J.C., Bittar, J.F., Ferreira, M.B., Leite, M.B., Merighe, G.K., Meirelles, F.V., 2008. Bos indicus or Bostaurus mitochondrial DNA-comparison of productive and reproductive breeding values in a Guzerat dairy herd. Genet. Mol. Res. 7, 592-602. Raymond, M.I., Rousset, F., 1995. GENEPOP (version 1.2) Population Ggenetics Software for Exact Tests and Ecumenicism. J. Heredity 86, 248-249. Rezazadeh, F., Hosseinzadeh, N., Jozani, R.J., Dianati, N., 2016. Comparison of some hematological parameters between Horses in an endurance competition. Anim. Vet. Sci. 4, 97-102. Sessions-Bresnahan, D.R., Reedy, S.E., Vick, M.M., Murphy, B.A., Fitzgerald, B.P., 2004. Development of a model for inducing transient insulin resistance in the mare, Preliminary implications regarding the estrous cycle. J. Anim. Sci. 82, 2321-2328. SPSS, 2016. Statistical package for social science, PC software, Version 20 for Windows Copyright© IBM SPSS Statistics 20. Terranova, P.F, Rice, V.M., 1997. Review, Cytokine involvement in ovarian processes. Am. J. Reprod. Immunol.37, 50-63. Van Weyenberg, S., Hesta, M., Buyse, J., Janssens, G.P., 2008.The effect of weight loss by energy restriction on metabolic profile and glucose tolerance in ponies. J Anim Physiol Anim Nutr (Berl.) 92, 538-545. Vick, M.M., Sessions, D.R., Murphy, B.A., Kennedy, E.L., Reedy, S.E., Fitzgerald, B.P., 2006. Obesity is associated with altered metabolic and reproductive activity in the mare, Effects of metformin on insulin sensitivity and reproductive cyclicity. Reprod. Fertil. Dev.18, 609-617. Waller, C.A., Thompson, D.L., Cartmill, J.A., Storer, W.A., Huff, N.K., 2006. Reproduction in high body condition mares with high versus low leptin concentrations. Theriogenology 66, 923-928. |
|||||||||||||||||||||||||||||||||||||||||||||||||||||||||||||||||||||||||||||||||||||||||||||||||||||||||||||||||||||||||||||||||||||||||||||||||||||||||||||||||||||||||||||||||||||||||||||||||||||||||||||||||||||||||||||||||||||||||||||||||||||||||||||||||||||||||||||||||||||||||