|
|
Journal of Advanced Veterinary Research Volume 10, Issue 2, 2020, Pages: 96-104 www.advetresearch.com |
|

|
Puerperal Metritis in Crossbreed (Tarentaise X Baladi) Cows: Metabolism-Related Biochemical and Haematological changes |
|||||||||||||||||||||||||||||||||||||||||||||||||||||||||
|
|
|||||||||||||||||||||||||||||||||||||||||||||||||||||||||
|
Mohammed H. Ramadan1, Alaa Eldin Zain Elabdeen Mahmoud2, Alaa E.B. Zeidan1, Ahmed Ezzat Ahmed3, 4, Ahmed S.A. Hassaneen3, 5* |
|||||||||||||||||||||||||||||||||||||||||||||||||||||||||
|
|
|||||||||||||||||||||||||||||||||||||||||||||||||||||||||
|
1Animal Production Research Institute (APRI), Dokki, Giza, Egypt. 2Department of Theriogenology, Obstetrics, and Artificial Insemination, Faculty of Veterinary Medicine, Sohag University, 82524, Sohag, Egypt. 3Department of Theriogenology, Obstetrics, and Artificial Insemination, Faculty of Veterinary Medicine, South Valley University, 83523, Qena, Egypt. 4Biology Department, Faculty of Science, King Khalid University, 61413 Abha, Saudi Arabia. 5Department of Veterinary Medicine, Faculty of Agriculture, University of Miyazaki, Japan. |
|||||||||||||||||||||||||||||||||||||||||||||||||||||||||
|
|
|||||||||||||||||||||||||||||||||||||||||||||||||||||||||
|
Received: 9 March 2020; Accepted: 30 March 2020 (*Corresponding author: ahmed.hassaneen@vet.svu.edu.eg) |
|||||||||||||||||||||||||||||||||||||||||||||||||||||||||
|
|
|||||||||||||||||||||||||||||||||||||||||||||||||||||||||
|
Abstract |
|||||||||||||||||||||||||||||||||||||||||||||||||||||||||
|
|
|||||||||||||||||||||||||||||||||||||||||||||||||||||||||
|
Breeding of crossbreed cow is of great significance in tropical and subtropical countries in order to maintain both high productivity and high ability to accommodate. To understand the haematological and biochemical changes related with puerperal metritis in crossbred cows as well as the effect of puerperal metritis on the fertility, the current study evaluated the relations of some metabolic, and biochemical changes to the puerperal metritis. After thorough clinical and gynaecological examination, blood and urine samples were collected from both the control cows (n=20) and metritis cows (n=19). Haemoglobin (Hb) concentrations and leukocytes count was determined. The concentrations of glucose, triglycerides, cholesterol, non-esterified fatty acids (NEFA), calcium, phosphorus, sodium, potassium, albumin, total protein, urea and progesterone hormone (P4) in blood, and ketone bodies were detected in urine at the following time-points (prepartum, partum, 1-week postpartum, and 2-weeks postpartum). Cows in the metritis group showed low Hb and high leukocytes count in the postpartum period. The metritis cows showed low glucose, low cholesterol, high NEFA, and low calcium levels. Blood NEFA, glucose, triglycerides, and calcium levels change significantly in puerperal metritis in crossbreed cows. |
|||||||||||||||||||||||||||||||||||||||||||||||||||||||||
Keywords: Negative energy balance, Non-esterified fatty acids, Transition period, Uterine infections
|
|||||||||||||||||||||||||||||||||||||||||||||||||||||||||
|
Introduction |
|||||||||||||||||||||||||||||||||||||||||||||||||||||||||
|
|
|||||||||||||||||||||||||||||||||||||||||||||||||||||||||
|
The importance of cattle production as a part of agriculture industry is increasing to meet the increasing demands for protein all over the world. In tropical and subtropical countries, crossbreeding of native breeds with pure high producing breeds such as Tarentaise is used for dual purpose breeding for beef and dairy production because crossbreeds are able to adapt in tropical and sub-tropical conditions than high producing pure breeds (Boonkum et al., 2011; Mellado et al., 2011). Reproductive problems are common causes of economic losses to both the individual owners/farmers and the dairy farming industry, as well. It was reported that the most critical period for both reproduction and production in cows is the transition period, which extends from 3 weeks prepartum to 3 weeks postpartum. Both metabolic and reproductive disorders mostly occur during this period (Drackley, 1999). Postpartum/puerperal metritis is one of the reproductive disorders that commonly diagnosed during the postpartum period. Metritis is a uterine bacterial infection that develops in many cows after calving (Sheldon et al., 2009). Moreover, some cows with normal calving also develop postpartum metritis (Magnus and Lali, 2009). Puerperal metritis primarily occurs in the first week postpartum (Sheldon et al., 2006; Leblanc, 2012), and about one third of cows may be clinically infected within the first 21 days postpartum (metritis), and about 10-20% retains endometritis after this period (Borsberry and Dobson, 1989; McDougall et al., 2007; Sheldon et al., 2009). It is clearly reported that fertility is largely reduced with uterine infection in dairy cows (McDougall et al., 2007; Pleticha et al., 2009). The prevalence of endometritis declines with time postpartum that cows examined at less than one month post-calving were at higher risk of endometritis than those examined at more than two months post-calving (McDougall et al., 2007), most of the infected cows recover spontaneously. Significant relationships between metabolic disorders and reproductive tract disorders such as metritis and endometritis were previously reported (Sheldon et al., 2006; Leblanc, 2012). It was found that there is a strong association between feed intake and the subsequent development of metritis (Huzzey et al., 2007). Body condition score (BCS) is very useful for evaluating the nutritional condition of cows (Hady et al., 1994). Severe negative energy balance (NEB) causes a significant decrease in BCS especially for the first thirty days postpartum (De Vries et al., 1999). It was reported that, reduced fertility in cows is related with low BCS (Starbuck et al., 2004). More specifically, a pervious study conducted by Giuliodori et al., (2013) showed that BCS negatively correlated with the incidence of metritis in cows. Leblanc (2008) reported that other conditions that may impair feed intake and immune function also increase the risk of metritis in cows. Previous studies showed that metabolic changes that associated with energy insufficiency were related to increased risk of metritis in cows (Butler, 2006; Wathes et al., 2007; Sordillo and Raphael, 2013). Previously, different research groups reported marked changes of both the metabolic and biochemical blood parameters during the transition period in cows (Kaczmarowski et al., 2006; Seifi et al., 2011). In buffalo, it was reported that plasma concentrations of Non-esterified fatty acids (NEFA) were significantly related with postpartum uterine infections (Mili et al., 2016). Moreover, postpartum cows with uterine infections and/or mastitis showed high levels of NEFA (Surlyasathapon et al., 2000; Hammon et al., 2006; Duffield et al., 2009). Detection of the abovementioned related parameters could be useful for early detection of the postpartum uterine infections and would improve the ability to minimize the possible reproductive and productive losses in cows. Therefore, the aim of the current study was to evaluate the levels of metabolic and haematological parameters during the transition period (prepartum, partum, and postpartum) of crossbreed cows with puerperal metritis. |
|||||||||||||||||||||||||||||||||||||||||||||||||||||||||
|
|
|||||||||||||||||||||||||||||||||||||||||||||||||||||||||
|
Materials and methods |
|||||||||||||||||||||||||||||||||||||||||||||||||||||||||
|
The present study was carried out in the Seds Animal Production Research Station, Animal Production Research Institute, Agricultural Research Center, Beni Suef Governorate, Egypt. This study was performed according to the Animal Ethics and Use Committee of the South Valley University for Veterinary Research, Qena, Egypt and all procedures were approved by the Department of Theriogenology, Obstetrics, and Artificial Insemination, Faculty of Veterinary Medicine, South Valley University Council (No. 232, 2018/02/FC). Animals In this study, 39 crossbreed cows (Egyptian Baladi X Tarentaise; a dual purpose breed raised for both the milk and meat production) were used at the Veterinary Practice in Beni Suef governorate (Seds Station), Animal Production Research Institute (APRI), Egypt. All cows were subjected to full clinical, as well as gynaecological examination before being included in the study. Cows were housed in free stalls, fed a diet formulated according to standard guidelines, with an ad libitum access to water. Cows were divided into two groups, control group included 20 cows (parity; 3.25 ± 0.33), and metritis group included 19 cows (parity; 3.00 ± 0.35); the control group had normal parturition and absence of any post-parturient metabolic disorders, while the metritis group included cows with post-parturient acute metritis. Clinical and gynaecological examination All cows were subjected to thorough clinical and gynaecological examination. Cows with pathologically poorly-involuted uterus, fetid watery reddish-brown vaginal discharge, and signs of systemic illness such as decreased milk yield, dullness, fever (≥39.5°C) within the first 3 weeks postpartum were diagnosed as puerperal/acute metritis (Sheldon et al., 2006). For each cow, a data sheet was recorded including the following data; animal number, age, parity, body weight, BCS, and health condition. Body condition Score (BCS) Body condition scores (BCS; scale of 1 to 5, with increments of 0.25) for all cows were assessed as described previously according to Ferguson method (Ferguson et al., 1994). Samples Blood Samples Twenty ml-blood samples were collected via jugular vein puncture into 3 types of vacutainer collecting tubes; the first one was coated with ethylene diamine tetra-acetic acid (EDTA) as anticoagulant for evaluation of the haematological parameters, the second type was coated with sodium (Na) fluoride for determination of glucose levels, and the third type was plain vacutainer tubes for separation of serum to measure other biochemical parameters including calcium (Ca), phosphorus (P), potassium, Na, cholesterol, triglycerides, albumin, total protein, and urea. Plasma and serum samples were separated, and stored at -20 °C till further analysis. Urine samples Ten ml-urine samples were collected from all cows at the same time of blood sampling for determination of ketone bodies. Urine sample collection was performed using a sterile vaginoscope through the vulva to visualize the external urethral orifice, then gentile insertion of a sterile disposable collecting plastic sheath inside the cow urethra. Assessment of the haematological parameters Assessment of haemoglobin (Hb) concentration (g/ dl) Haemoglobin concentration (g/dl) was measured by using Hb assay kits (Diamond Egypt D-P International, Hannover, Germany) based on cyanmethemoglobin method that has been adopted as a standard method according to Van Kampen (1961). Determination of total white blood cells (WBCs) count Total white blood cells count was determined by using a standard hemocytometer phase contrast microscope according to Hawkey and Dennett (1989). Biochemical analyses Biochemical analyses were conducted by CHEM -7 (A next-generation automatic clinical Biochemistry analyser, ERBA Diagnostics Mannheim GmbH, Mannheim, Germany) Determination of energy related parameters Determination of glucose levels (mg/dl) Plasma glucose level (mg/dl) was performed by using glucose kits (GLUCOSE GOD – PAP kits, SPINREACT, Spain) according to Trinder (1969) using spectrophotometer at wavelength 505 nm Determination of cholesterol levels (mg/dl) Serum cholesterol level (mg/dl) was determined using cholesterol kits (CHOLESTEROL CHOD-POD, SPINREACT, Spain) according to Meiattini et al. (1978) using spectrophotometer at wavelength 505 nm. Determination of triglycerides levels (mg/dl) Serum triglyceride level (mg/dl) was determined by using triglycerides kits (TRIGLYCERIDES-LQ GPO-POD, SPINREACT, Spain) according to Bucolo and David (1973) using spectrophotometer at wavelength 505 nm. Determination of Non-esterified fatty acids (mmol/l) Serum NEFA (mmol/l) was assessed using NEFA kits (Colorimetric, Randox Reagents, Randox Laboratories Ltd., United Kingdom) according to the manufacturer’s instructions Determination of metabolism related minerals in serum (mg/dl) Determination of Ca levels (mg/dl) Serum Ca level (mg/dl) was determined by using Ca kits (CALCIUM-oC v/v kits, SPINREACT, Spain) according to Kessler and Wolfman (1964) using spectrophotometer at wavelength 570 nm. Determination of P levels (mg/dl) Serum P level (mg/dl) was determined using P kits (PHOSPHORUS -UVkits, SPINREACT, Spain) according to Daly and Ertingshausen (1972) using spectrophotometer at wavelength 340 nm. Determination of K levels (mmol/l) Serum K level (mmol/l) was determined by using K kits (POTASSIUM-p kits TPB-Na Method, SPINREACT, Spain) according to Sunderman and Sunderman (1958) using spectrophotometer at wavelength 578 nm. Determination of Na levels (mmol/l) Serum Na level (mmol/l) was determined by use reagent from Na kits (SODIUM-p kits Mg-Uranylacetate Method, SPINREACT, Spain) according to Trinder (1951) using spectrophotometer at wavelength 600 nm. Determination of serum proteins and urea levels Determination of total protein levels (g/dl) Serum total protein level (g/dl) was determined by using total protein kits (Total protein, Biuret, Colorimetric, SPINREACT, Spain) using spectrophotometer at wavelength 546 nm. Determination of albumin levels (g/dl) Serum albumin level (g/dl) was determined by using albumin kits (ALBUMIN Bromocresol green. Colorimetric, SPINREACT, Spain) according to Rodkey (1965) using spectrophotometer at wavelength 630 nm. Determination of urea level (mg/dl) Serum urea level (mg/dl) was determined by using urea kits (UREA kits, SPINREACT, Spain) using spectrophotometer at wavelength 578 nm. Hormonal analysis of progesterone levels (P4; ng/dl): Serum P4 levels (ng/dl) were measured using radioimmunoassay (RIA) kits according to Kubasik et al. (1984). Evaluation of ketone bodies in urine Ketone bodies level in urine was estimated by using Medi-Test Comb-10 Glucose/Ketone kits. The intensity of ketone bodies was distinguished as; none (–), traces (+/–), positive (+) and strongly positive (++/+++). For evaluation of reproductive parameters, pregnancy diagnosis was performed at 45-60 days post insemination. The fertility indices were assessed according to Grusenmeyer et al., (1992). 1. Interval from calving to the first estrus (days). 2. Number of services per conception (number). 3. Days-open as the intervals from calving to conception (days). Statistical analyses Statistical analyses were conducted according to SPSS, Statistical significance was determined by analysis variance (ANOVA) multiple range and simple regression. Statistically significant differences values were set at P ≤ 0.05. |
|||||||||||||||||||||||||||||||||||||||||||||||||||||||||
|
|
|||||||||||||||||||||||||||||||||||||||||||||||||||||||||
|
Results |
|||||||||||||||||||||||||||||||||||||||||||||||||||||||||
|
Negative effect of metritis on the fertility parameters Metritis significantly prolonged the duration to first estrus (d; mean± SEM) in the affected metritis cows with recorded values of 81.16±2.74 and 37.95±1.16 in the metritis and control cows, respectively. And the days open (d; mean± SEM) was significantly higher in the metritis cows compare to the control cows with 99.21±3.99 and 42.10±1.80 days, respectively. Moreover, the required number of services (n; mean± SEM) was significantly higher in the metritis cows (1.79± 0.16) compare to the control cows (1.20±0.09) (Table 1). Table 1. Fertility parameters including duration to the 1st estrus (d), days open (n), and number of services (n) until conception in control and metritis cows
Values are expressed as Mean± SEM. (*) means significant at (P<0.05), (d) means day, and (n) means number. Body condition score in cows with puerperal metritis Both the control and metritis cows showed significant decreases in the BCS values at 2-weeks postpartum in compare to those at prepartum, and partum with BCS± SEM; 2.93±0.07 and 2.68±0.07, respectively (Table 2). Table 2. Body condition score (BCS; 5-grade scoring) in control and metritis cows during the transition period (prepartum, partum, 1-week postpartum, and 2-weeks postpartum):
Values are expressed as Mean± SEM. Different superscripts mean significant (P<0.05); capital letters for the control group (central column), and small letters for the metritis group (right column).
Haematological parameters in metritis cows
Determination of Hb concentrations (g/dl)
In this study, Hb concentrations (g/dl) were significantly lower in the metritis cows at the partum and 1-week postpartum time-points with average Hb concentrations (mean± SEM) of 10.56±0.17 g/dl, and 10.58±0.22 g/dl, respectively compared with the prepartum time point that had Hb concentration of 11.27±0.17 g/dl, while no changes were reported between these three time-points in the control group (Table 3). Moreover, Hb concentrations in partum and 1-week postpartum were significantly lower than those in the control group.
Determination of WBCs count
In this study, it was detected that the WBCs counts were significantly higher in the metritis cows at both postpartum time-points. Moreover, the WBCs counts at these time-points were significantly higher in the metritis cows with WBCs± SEM of 7097.4±152.1 and 6119.5±222.6 than those in the control cows 6092.5±124.0 and 5955.3±123.0 for 1-week and 2-weeks postpartum, respectively (Table 3). Table 3. Haematological parameters including haemoglobin concentrations (g/dl) and WBCs counts (n) in control and metritis cows during the transition period
Values are expressed as Mean± SEM. Different superscripts mean significant (P<0.05); capital letters for the control group (central column), and small letters for the metritis group (right column). (*) means significant between the values of the control group and those of the metritis group at the same time-point (P<0.05). (#) values were statistically analysed to one time-point postpartum for the control cows due to inability to analyse some samples.
Energy status and metritis
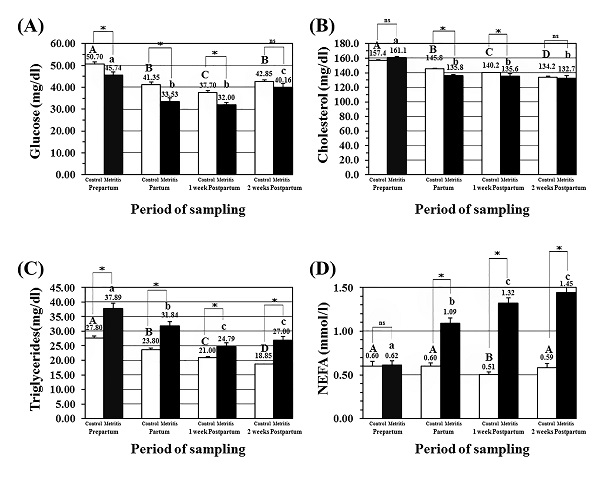
Plasma glucose level (mg/dl; mean± SEM) in the metritis cows was significantly lower at partum, and at both postpartum periods. Moreover, the values of glucose concentrations in the metritis cows at all time-points were significantly lower than those in the control cows (Fig.1A). Serum cholesterol level (mg/dl; mean± SEM) in the metritis cows was significantly lower at partum, and at both postpartum time-points. Moreover, the values of glucose concentrations in the metritis cows at these three time-points were significantly lower than those in the control cows (Fig. 1B). Serum triglycerides level (mg/dl; mean± SEM) in the metritis cows was significantly lower at partum, and at both postpartum time-points. Moreover, the values of triglycerides concentrations in the metritis cows at all time-points were significantly higher than those in the control cows (Fig. 1C). Serum NEFA level (mmol/l; mean± SEM) in the metritis cows was significantly higher at partum, and at both postpartum time-points. Moreover, the values of NEFA concentrations in the metritis cows at these three time-points were significantly higher than those time-points in the control cows (Fig. 1D).
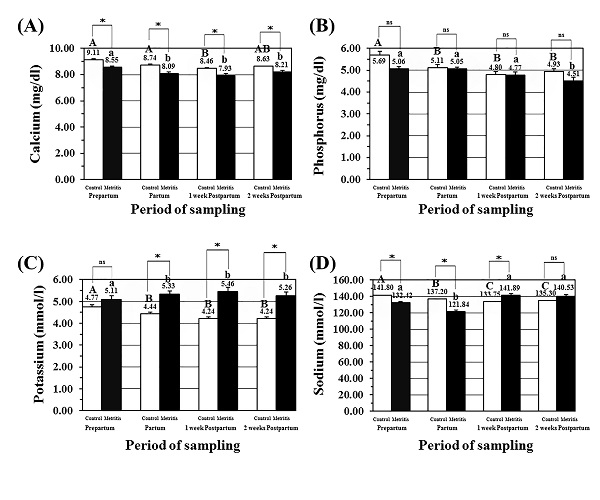
Fig. 1. Concentrations of energy related parameters in the metritis cows blood; (A) plasma glucose levels (mg/dl; mean± SEM), (B) serum cholesterol levels (mg/dl; mean± SEM), (C) serum triglycerides levels (mg/dl; mean± SEM), and (D) serum NEFA levels (mmol/l; mean± SEM) in both the control (open) and metritis cows (black) in prepartum, partum, 1-week, and 2-weeks postpartum time points. Asterisk (*) means significant between the values of the control and those of the metritis cows at the same time-point (P<0.05). Different superscripts mean significant (P<0.05); capital letters for the control cows and small letters for the metritis cows. Determination of metabolism related minerals Serum Ca level (mg/dl; mean± SEM) in the metritis cows was significantly lower at partum, and at both postpartum time-points. Moreover, the values of Ca levels in the metritis cows at all time-points were significantly lower than those in the control cows (Fig. 2A). Serum P level (mg/dl; mean± SEM) in the metritis cows was significantly lower in 2-weeks postpartum time-point. However, no changes in the values of P levels were detected between both the metritis and control cows, in all time points (Fig. 2B). Serum K level (mmol/l; mean± SEM) in the metritis cows was significantly higher at partum, and at both postpartum time-points. Moreover, the values of K levels in the metritis cows were significantly higher than those in the control cows at those time-points (Fig. 2C). Serum Na level (mmol/l; mean± SEM) in the metritis cows was significantly lower at partum time point when compared to prepartum, both postpartum time-points. Moreover, the values of Na levels in the metritis cows were significantly lower than those in the control cows at prepartum, partum, and 1-week postpartum time-points (Fig. 2D).
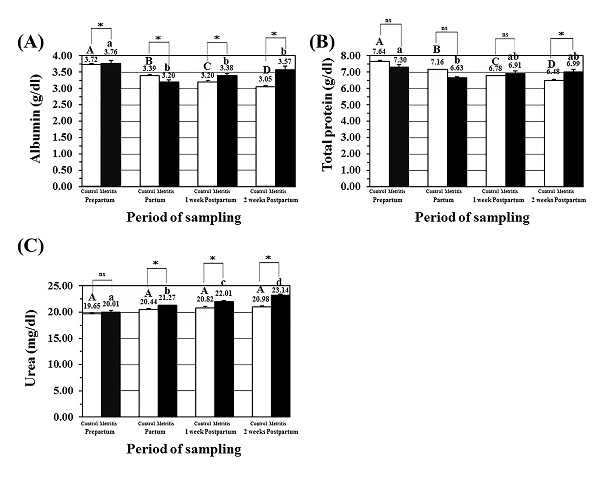
Fig. 2. Concentrations of metabolism related minerals in the metritis cow’s serum; (A) serum calcium (Ca) levels (mg/dl; mean± SEM), (B) serum phosphorus (P) levels (mg/dl; mean± SEM), (C) serum potassium (K) levels (mmol/l; mean± SEM), and (D) serum sodium (Na) levels (mmol/l; mean± SEM) in both the control (open) and metritis cows (black) in prepartum, partum, 1-week, and 2-weeks postpartum time points. Asterisk (*) means significant between the values of the control and those of the metritis cows at the same time-point (P<0.05). Different superscripts mean significant (P<0.05); capital letters for the control cows and small letters for the metritis cows. Serum proteins and protein metabolites Serum albumin level (g/dl; mean± SEM) in the metritis cows was significantly lower at partum, and both postpartum time-points in metritis cows. Moreover, the values of albumin levels in the metritis cows were significantly variable when compared to the same time-points in the control cows (Fig. 3A). Serum total protein level (g/dl; mean± SEM) in the metritis cows was significantly lower at partum time point when compared to prepartum, and both postpartum time-points in metritis cows. Moreover, the P concentration was significantly higher in the metritis cows than that in the control cows at 2-weeks postpartum (Fig. 3B). Serum urea level (mg/dl; mean± SEM) in the metritis cows was significantly higher at partum, and both postpartum time-points. Moreover, the values of urea concentrations in the metritis cows were significantly higher than those in the control cows at the same previously mentioned time points (Fig. 3C).
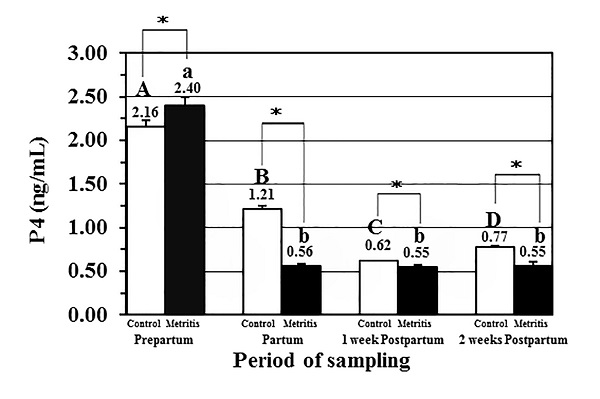
Fig. 3. Concentrations of protein and protein metabolites in the metritis cow’s serum; (A) serum albumin levels (g/dl; mean± SEM), (B) serum total protein levels (g/dl; mean± SEM), and (C) serum urea levels (mg/dl; mean± SEM) in both the control (open) and metritis cows (black) in prepartum, partum, 1-week, and 2-weeks postpartum time points. Asterisk (*) means significant between the values of the control and those of the metritis cows at the same time-point (P<0.05). Different superscripts mean significant (P<0.05); capital letters for the control cows and small letters for the metritis cows. Serum P4 levels (ng/dl) in the metritis cows Serum P4 hormone level (ng/dl; mean± SEM) was significantly low at partum, and at both postpartum time-points in both the metritis and control cows. Moreover, the values of P4 concentrations in the metritis cows were significantly higher than those in the control cows at these three time-points (Fig. 4).
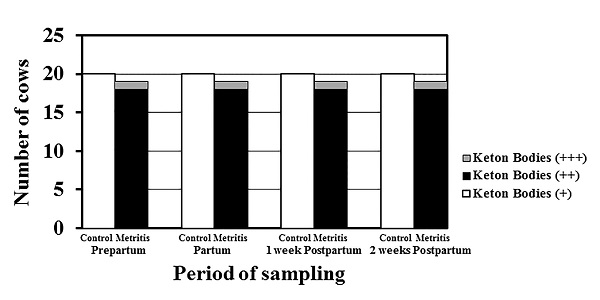
Fig. 4. Serum progesterone (P4) levels (ng/ml; mean± SEM) in both the control (open) and metritis cows (black) in prepartum, partum, 1-week, and 2-weeks postpartum time points. Asterisk (*) means significant between the values of the control and those of the metritis cows at the same time-point (P<0.05). Different superscripts mean significant (P<0.05); capital letters for the control cows and small letters for the metritis cows. Ketone bodies in urine of metritis cows Urine ketone bodies in the metritis cows were higher than those in the control cows; 18 cows had (++) ketone bodies in urine, and one cow had (+++) during the whole transition period while the control cows (n=20) had ketone bodies of (+) score in all cows during the whole transition period (Fig. 5).
Fig. 5. Urine ketone bodies in both the control (open; n=20) and metritis cows (black; n=19, and gray; n=1) in prepartum, partum, 1-week, and 2-weeks postpartum time points. |
|||||||||||||||||||||||||||||||||||||||||||||||||||||||||
|
|
|||||||||||||||||||||||||||||||||||||||||||||||||||||||||
|
Discussion |
|||||||||||||||||||||||||||||||||||||||||||||||||||||||||
|
The current study evaluated the relation between metritis and both the energy status and the associated metabolic changes in crossbreed dual-purpose cows during the transition period. Puerperal metritis is one of the most important clinical disorders that cause major losses in cows. In this study, metritis had negatively affected the fertility parameters in the affected cows, the significant negative effect of metritis showed more than two times increase in both the average day open (±SEM) and the duration to the first estrus (±SEM). Moreover, the obtained results showed that metritis cows required significantly higher number of services (±SEM) than control cows. The negative effect of metritis on all these fertility parameters increases the need to better understanding of metritis-associated parameters in order to minimize the economic losses of low fertility. This study revealed a strong relation between the occurrence of metritis and the energy status of the cows during the transition period, the level of the blood parameters related with the energy status significantly changed in the metritis cows; in the current study, the plasma levels of glucose, the primary source of energy, were significantly lower in metritis cows, moreover, the plasma glucose levels in the metritis cows were significantly lower in the partum and postpartum periods than the prepartum period. The decrease in plasma glucose level was previously reported in Holstein cows during the partum and postpartum periods (Elitok et al., 2006), which is likely due to the increasing demands due to mammary glands development (Guo et al., 2007), and milk production (Leblanc et al., 2006; Esposito et al., 2014). Plasma glucose level cannot be used as an indicator to measure of energy status because of the physiological homeostatic regulation (Herdt, 2000). The energy insufficiency due to low glucose level reported in this study was likely resulted in some metabolic events that increased fat mobilization (Kaneene et al., 1997). The excessive fat mobilization due to NEB causes increase of serum NEFA levels (Seifi et al., 2007; Laszlo et al., 2009). In the current study, there was more than two-times significant increase in the serum NEFA levels in the metritis cows during the postpartum period, moreover, in these metritis cows, the serum NEFA levels were significantly higher in the partum and postpartum periods. Both the increased NEFA levels and the decreased glucose levels are likely a predisposing factor for development of metritis in the postpartum period (Markiewicz et al., 2001). It was reported that determination of glucose concentrations together with NEFA concentrations in cows would provide further insights into the adaptation of cows to NEB (Herdt, 2000). The mobilized NEFA serves as an alternative energy source in in order to preserve the limited available glucose (Leroy et al., 2008; Leroy et al., 2014). Mili et al. (2016) suggested that elevated levels of plasma NEFA coupled with low Ca and low glucose were associated with the increased risk of postpartum uterine infections. It should be noted that high serum NEFA levels during the transition period (Laszlo et al., 2009; Ospina et al., 2010) was significantly associated with the development of clinical postpartum disorders in cows including metritis (Hammon et al., 2006; Seifi et al., 2007), ketosis (Ospina et al., 2010), and retained fetal membranes (Nogalski et al., 2012; Rayan et al., 2019). In the present study, serum triglycerides levels in metritis cows were significantly higher than control cows in all prepartum, partum and postpartum periods; this would be attributed to high fat mobilization in metritis cows. It was previously suggested that higher levels of triglycerides in metritis cows is a possible result of more energy needs (Seifi et al., 2007). On the other hand, the obtained results revealed that the metritis cows had lower serum levels of cholesterol. Serum cholesterol level can be used as an indicator of disease risk in postpartum dairy cows (Kaneene et al., 1997). Semacan and Sevinc (2005) had reported that serum cholesterol level was lower in cows with clinical disorders than the control cows. The changes in serum cholesterol level are a possible result of decreased feed intake, as the cholesterol is mostly of an intestinal origin in cows (Uchide et al., 1997). All these findings indicated that metabolic imbalance and NEB may contribute to the increased risk of metritis. This present study revealed lower serum Ca and P levels with higher serum K levels, which may be attributed to consumption of Ca during parturition and beginning of lactation. The lower Ca and P levels are likely because of increased milk production. Lower P levels may be attributed to low feed intake and the subsequent development of metritis (Huzzey et al., 2007). In this study, significantly lower serum Na level was reported in metritis cows at partum compared to both the prepartum and postpartum periods. This lower Na level is likely attributed to large losses of fluids during calving and the post-calving production of colostrum. Pervious study reported no significant change in serum Na and K at prepartum, partum, and, postpartum periods (Nazifi and Sami, 1997). Urea level was significantly high all over the time period of the current study, which is a possible result of more mobilization of protein and losing of BCS. In the present study, the BCS was significantly lower in postpartum period. Cows with low BCS and NEB are more likely to develop clinical problems such as metritis, mastitis and ketosis than normal cows with positive energy balance (Mulligan and Doherty, 2008). The present study showed lower serum albumin level in the partum and postpartum periods, which may be related to the high energy demands during these defined periods, with no much variation in total protein, similar results were reported by Magnus and Lali (2009). In the present study, the metritis cows had lower Hb concentrations in the partum and postpartum periods and higher WBCs count in the postpartum period. This lower Hb may be caused by the large losses of blood during parturition. The significant increase of WBCs count in the postpartum period in metritis cows is an indicator of the immune defence response against metritis. All metritis cows had high amount of urine ketone bodies than that in the control cows, high amount of ketone bodies in urine of metritis cows was previously reported by Magnus and Lali (2009). Metritis cows are likely affected with postpartum metabolic ketosis. |
|||||||||||||||||||||||||||||||||||||||||||||||||||||||||
|
|
|||||||||||||||||||||||||||||||||||||||||||||||||||||||||
|
Conclusion |
|||||||||||||||||||||||||||||||||||||||||||||||||||||||||
|
Puerperal metritis negatively affects the fertility of crossbreed cows in tropical and subtropical conditions. This study clarified the relation between metritis and the associated metabolic changes in crossbreed dual-purpose cows during the transition period. Blood NEFA, glucose, triglycerides, and calcium levels change significantly during puerperal metritis in cows. |
|||||||||||||||||||||||||||||||||||||||||||||||||||||||||
|
|
|||||||||||||||||||||||||||||||||||||||||||||||||||||||||
|
Acknowledgments |
|||||||||||||||||||||||||||||||||||||||||||||||||||||||||
|
The authors would like to thank all members of the Animal Production Research Institute (APRI), El-Dokki, Giza, Egypt and all members of Department of Theriogenology, Obstetrics, and Artificial Insemination, Faculty of Veterinary Medicine, South Valley University, Qena, Egypt for their assistance, and support. |
|||||||||||||||||||||||||||||||||||||||||||||||||||||||||
|
|
|||||||||||||||||||||||||||||||||||||||||||||||||||||||||
|
Conflict of Interests |
|||||||||||||||||||||||||||||||||||||||||||||||||||||||||
|
|
|||||||||||||||||||||||||||||||||||||||||||||||||||||||||
|
The authors declare that there is no conflict of interest. |
|||||||||||||||||||||||||||||||||||||||||||||||||||||||||
|
|
|||||||||||||||||||||||||||||||||||||||||||||||||||||||||
|
References |
|||||||||||||||||||||||||||||||||||||||||||||||||||||||||
|
|
|||||||||||||||||||||||||||||||||||||||||||||||||||||||||
|
Boonkum, W., Misztal, I., Duangjinda, M., Pattarajinda, V., Tumwasorn, S., Sanpote, J., 2011. Genetic effects of heat stress on milk yield of Thai Holstein crossbreds. J. Dairy Sci. 94, 487-492. Borsberry, S., Dobson, H., 1989. Periparturient diseases and their effect on reproductive performance in five dairy herds. Vet. Rec. 124, 217-219. Bucolo, G., David, H., 1973. Quantitative determination of serum triglycerides by the use of enzymes. Clin. Chem. 19, 476-482. Butler, W.R., 2006. Relationships of Negative Energy Balance with Fertility. Penn State Dairy Cattle Nutrition Workshop 2006, pp. 51-60. Daly, J.A., Ertingshausen, G., 1972. Direct Method for Determining Inorganic Phosphate in Serum with the “CentrifiChem”. Clin. Chem. 18, 263–265. De Vries, M.J., Der Beek, S.V., Kaal-Lansbergen, L.M., Ouweltjes, W., Wilmink, J.B., 1999. Modeling of energy bal-ance in early lactation and the effect of energy deficits in earlylactation on first detected estrus postpartum in dairy cows. J. Dairy Sci. 82:1927–1934. Drackley, J.K., 1999. Biology of Dairy Cows during the Transition Period: the Final Frontier? J. Dairy Sci. 82, 2259–2273. Duffield, T.F., Lisemore, K.D., McBride, B.W., 2009. Impact of hyperketonemia in early lactation in dairy cows on health and production. J. Dairy Sci. 92, 571-580. Elitok, B., Kabu, M., Elitok, O.M., 2006. Evaluation of Liver Function Tests in Cows during Periparturient Period. F.Ü. Sağlık Bil. Dergisi 20, 205-209. Esposito, G., Irons, P.C., Webb, E.C., Chapwanya, A., 2014. Interactions between negative energy balance, metabolic diseases, uterine health and immune response in transition dairy cows. Anim. Reprod. Sci. 144, 60-71. Ferguson, J.D., Galligan, D.T., Thomsen, N., 1994. Principal descriptors of body condition score in Holstein cows. J. Dairy Sci. 77, 2695-2703. Giuliodori, M.J., Magnasco, R.P., Becu-Villalobos, D., Lacau-Mengido, I.M., Risco, C.A., de la Sota, R.L., 2013. Metritis in Dairy Cows: Risk Factors and Reproductive Performance. J. Dairy Sci. 96, 3621-3631. Grusenmeyer, D., Hillers, I., Williams, G., 1992. Evaluating dairy herd reproductive status using DHI records. Wash. State Univ. Library, pp. 1-16. Guo, J., Peters, R.R., Kohn, R.A., 2007. Effect of a Transition Diet on Production Performance and Metabolism in Periparturient Dairy Cows. J. Dairy Sci. 90, 5247-5258. Hady, P.J., Domecq, J.J., Kaneene, J.B., 1994. Frequency and precision of body condition scoring in dairy cattle. J. Dairy Sci. 77, 1543-1547. Hammon, D.S., Evjen, I.M., Dhiman, T.R., Goff, J.P., Walters, J.L., 2006. Neutrophil function and energy status in Holstein cows with uterine health disorders. Veterinary Immunology and Immunopathology 113, 21–29. Hawkey, C., M., Dennett, T., B., 1989. Color Atlas of Comparative Veterinary Hematology. Ames, Iowa: Iowa State University Press. Herdt, T.H., 2000. Variability characteristics and test selection in herd level nutritional and metabolic profile testing. Veterinary Clinics of North America. Food Animal Practice 16, 387-403. Huzzey, J.M., Veira, D.M., Weary, D.M., von Keyserlingk, M.A.G., 2007. Prepartum behavior and dry matter intake identify dairy cows at risk for metritis. J. Dairy Sci. 90, 3220–3233. Kaczmarowski, M., Malinowski, E., Markiewicz, H., 2006. Some hormonal andbiochemical blood indices in cows with retained placenta and puerperal metritis. Bulletin of the Veterinary Institute in Pulaway 50, 89–92. Kaneene, J.B., Miller, R., Herdt, T.H., Gardiner, J.C., 1997. The association of serum nonesterified fatty acids and cholesterol, management and feeding practices with peripartum disease in dairy cows. Prev. Vet. Med. 31, 59–72. Kessler, G., Wolfman, M., 1964. An automated procedure for the simultaneous determination of Calcium and Phosphorus. Clin. Chem. 10, 686-703. Kubasik, N.B., Hallauer, G.D., Brodows, R.G., 1984. Evaluation of a direct solid-phase radio-immunoassay for progesterone, useful for monitoring luteal function. Clin. Chem. 30, 284-286. Laszlo, K., Otto, S., Viktor, J., Laszlone, T., Beckers, J.F., Endre, B., 2009. Examination of some reproductive indices of peripartal period in relation with energy metabolism in dairy cows, Journal of Hungarian Physicians (Magyar Allatorvosok Lapja) 131, 259-269. Leblanc, S., 2008. Postpartum uterine disease and dairy herd reproductive performance–A review. The Veterinary Journal 176, 102–114. Leblanc, S., 2012. Interactions of metabolism, inflammation, and reproductive tract health in the postpartum period in dairy cattle. Reproduction in Domestic Animals 47, 18–30. Leblanc, S., Lissemore, K., Kelton, D., Duffield, T., Leslie, K., 2006. Major advances in disease prevention in dairy cattle. J. Dairy Sci. 89, 1267-1279. Leroy, J., Sturmey, R.J., Hoeck, V.V., Bie, J.D., McKeegan, P.J., Bols, P., 2014. Dietary Fat Supplementation and the Consequences for Oocyte and Embryo Quality: Hype or Significant Benefit for Dairy Cow Reproduction? Reprod. Dom. Anim. 49, 353-361. Leroy, J., van Soom, A., Opsomer, G., Bols, P., 2008. The consequences of metabolic changes in high-yielding dairy cows on oocyte and embryo quality. Animal 2, 1120–1127. Magnus, P.K., Lali, F. 2009. Serum Biochemical Profile of Post-Partum Metritic Cow. Veterinary World 2, 27-28. Markiewicz, H., Kuzma, K., Malinowski, E., 2001. Predisposing Factors for Puerperal Metritis in Cows. Bulletin of the Veterinary Institute in Pulawy 45, 281-288. McDougall, S., Macaulay, R., Compton, C., 2007. Association between endometritis diagnosis using a novel intravaginal device and reproductive performance in dairy cattle. Anim. Reprod. Sci. 99, 9-23. Meiattini, F., Prencipe, L., Bardelli, F., Giannini, G., Tarli, P., 1978. The 4 hydroxybenzoate/4-aminophenazone Chromogenic System Used in the Enzymatic Determination of Serum Cholesterol. Clin. Chem. 24, 2161-2165.
Mellado, M., Coronel, F., Estrada, A., Rios, F.G., 2011. Lactation performance of Holstein and Holstein x gyr cattle under intensive condition in a subtropical environment. Trop. Subtropical Agroecosystems 14, 927-931. Mili, B., Pandita S., Kumar, B.S., 2016. Association of Blood Metabolites with Reproductive Disorders in Postpartum Murrah Buffaloes. Buffalo Bulletin 35, 643-651. Mulligan, F.J., Doherty, M.L., 2008. Production diseases of the transition cow. The Veterinary Journal 176, 3-9. Nazifi, S., Sami, M., 1997. Concentration of Serum Electrolytes in Holstein Cows at Late Pregnancy, Parturition and Post Parturition Periods. J. Appl. Anim. Res. 11, 189-193. Nogalski, Z., Wroński, M., Sobczuk-Szul, M., Mochol, M., Pogorzelska, P., 2012. The effect of body energy reserve mobilization on the fatty acid profile of milk in high-yielding cows. Asian Australian J. Anim. Sci. 25, 1712-1720. Ospina, P.A., Nydam, D.V., Stokol, T., Overton, T.R., 2010. Evaluation of Nonesterified Fatty Acids and Beta-Hydroxybutyrate in Transition Dairy Cattle in the Northeastern United States: Critical Thresholds for Prediction of Clinical Diseases. J. Dairy Sci. 93, 546-554. Pleticha, S., Drillich, M., Heuwieser, W., 2009. Evaluation of the Metricheck device and the gloved hand for the diagnosis of clinical endometritis in dairy cows. J. Dairy Sci. 92, 5429-5435. Rayan, M.O., Zain El-abedeen, A.E., Abd Ellah, M.R., 2019. Some Metabolic Parameters During Transition Period in Dairy Cows with and without Retained Fetal Membranes. J. Adv. Vet. Res. 9, 45-48. Rodkey, F.L., 1965. Direct spectrophotometric determination of albumin in human serum. Clin. Chem. 11, 478-487. Seifi, H.A., Gorji-Dooz, M., Mohri, M., 2007. Variations of energy-related biochemical metabolites during transition period in dairy cows. Comp. Clin. Pathol. 16, 253–258. Seifi, H.A., Leblanc, S.J., Leslie, K.E., Duffield, T.F., 2011. Metabolic predictors of post-partum disease and culling risk in dairy cattle. Vet. J. 188, 216–220. Semacan, A., Sevinc, M., 2005. Liver function in cows with retained placenta. Turk. J. Vet. Anim. Sci. 29, 775- 778. Sheldon, I.M., Cronin, J., Goetze, L., Donofrio, G., Schuberth, H.J., 2009. Defining postpartum uterine disease and the mechanisms of infection and immunity in the female reproductive tract in cattle. Biol. Reprod. 81, 1025-1032. Sheldon, I.M., Lewis, G.S., Leblanc, S., Gilbert, R.O., 2006. Defining postpartum uterine disease in cattle. Theriogenology 65, 1516-1530. Sordillo, L.M., Raphael, W., 2013. Significance of Metabolic Stress, Lipid Mobilization, and Inflammation on Transition Cow Disorders. Vet. Cl. North Am. Food Anim. Prac. 29, 267-278. Starbuck, M.J., Dailey, R.A., Inskeep, E.K., 2004. Factors affecting retention of early pregnancy in dairy cattle. Anim. Reprod. Sci. 84, 27-39. Sunderman, F.W., Sunderman, F.W., 1958. Studies in Serum Electrolytes. XXII. A Rapid, Reliable Method for Serum Potassium determination. Am. J. Clin. Pathol. 29, 95-103. Surlyasathapon, W., Heuer, C., Noordhuizen-Stassen, E.N., Schukken, Y.H., 2000. Hyperketonemia and the Impairment of Udder Defense: A Review. Vet. Res. 31, 397-412. Trinder, P., 1951. A Rapid Method for the Determination of Sodium in Serum. Can. J. Med. Sci. 907, 596-599. Trinder, P., 1969. Determination of Blood Glucose Using an Oxidase-Peroxidase System with a Non-Carcinogenic Chromogen. J. Clin. Pathol. 22, 158-161. Uchide, T., Tohya, Y., Onda, K., Matsuki, N., Inaba, M., Ono, K., 1997. Apolipoprotein B concentrations in lipoproteins in in cows. J. Vet. Med. Sci. 59, 711-714. Van Kampen, E.J., 1961. Standardization of the hemoglobinometry. The haemolysis cyanid method. Clin. Chim. Acta 6, 538–541. Wathes, D., C., Fenwicka, M., Chenga, Z., Bournea, N., Llewell, S., Morrisb, D.G., Kennyc, D., Murphyd, J., Fitzpatrickb, R., 2007. Influence of negative energy balance on cyclicity and fertility in the high producing dairy cow. Theriogenology 68, S232-S241. |
|||||||||||||||||||||||||||||||||||||||||||||||||||||||||